

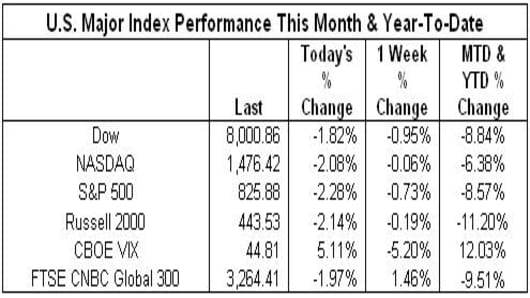
On a week dominated by earnings, the economic stimulus plan and discussions over a government-run "bad bank," the major US markets were flat to negative on the week. The markets also close out January in negative territory led by the Russell losing over 11%, while the NASDAQ has been the best performer for the month and year-to-date losing only 6.38%.
**The Dow suffered its worst January ever losing 8.84%; the next biggest loss in January was in 1916 when the Dow lost 8.6%
**The S&P suffered its worst January ever losing 8.57%; the next biggest loss in January was in 1970when the S&P lost 7.6%
Index Impact:
-IBM (IBM) had the most positive impact on the Dow, up over 2% for the week.
**In January and YTD, the top Dow performer by % gain is also IBM up almost 9% YTD
-Caterpillar (CAT) had the most negative impact on the Dow, down over 13% for the week
**In January and YTD, Bank of America (BAC) is the worst Dow performer by % loss, down almost 54% YTD.
-Wells Fargo (WFC) had the most positive impact on the S&P 500, up over 19% for the week.
**In January and YTD, the top S&P performer by % gain is Micron (MU) up almost 41% YTD
-Pfizer (PFE) had the most negative impact on the S&P 500, down over 16% for the week
**In January and YTD, Fifth Third Bancorp (FITB) is the worst S&P performer by % loss, down over 71% YTD.
-Google (GOOG) had the most positive impact on the NASDAQ 100, up over 4% for the week.
**In January and YTD, the top NASDAQ 100 performer by % gain is Research in Motion (RIMM), up almost 37% YTD
-Cisco (CSCO) had the most negative impact on the NASDAQ 100, down almost 6% for the week.
**In January and YTD, the worst NASDAQ 100 performer by % gain is Logitech (LOGI), down over 38% YTD
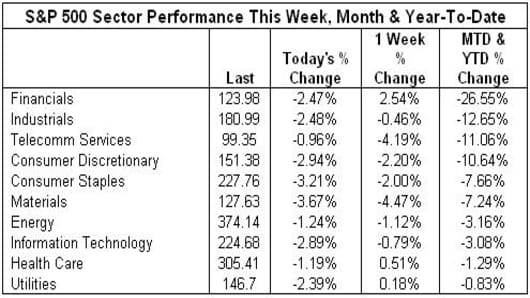
7 out of 10 S&P sectors were negative for the week led by Materials down almost 5% for the week. Financials were the best performing group for the week, up almost 3%.
*In January and YTD 10 out of 10 S&P sectors are negative, Financials are the worst performing sector, down almost 27% while Utilities are the least negative losing slightly less than 1% YTD.
· Materials were dragged down by Dow Chemical (DOW) down over 19% for the week
· Financials was helped by State Street (STT) up almost 20% for the week
On a week dominated by earnings, the economic stimulus plan and discussions over a government-run "bad bank," the major US markets were flat to negative on the week. The markets also close out January in negative territory led by the Russell losing over 11%, while the NASDAQ has been the best performer for the month and year-to-date losing only 6.38%.
**The Dow suffered its worst January ever losing 8.84%; the next biggest loss in January was in 1916 when the Dow lost 8.6%
**The S&P suffered its worst January ever losing 8.57%; the next biggest loss in January was in 1970when the S&P lost 7.6%
Index Impact:
-IBM (IBM) had the most positive impact on the Dow, up over 2% for the week.
**In January and YTD, the top Dow performer by % gain is also IBM up almost 9% YTD
-Caterpillar (CAT) had the most negative impact on the Dow, down over 13% for the week
**In January and YTD, Bank of America (BAC) is the worst Dow performer by % loss, down almost 54% YTD.
-Wells Fargo (WFC) had the most positive impact on the S&P 500, up over 19% for the week.
**In January and YTD, the top S&P performer by % gain is Micron (MU) up almost 41% YTD
-Pfizer (PFE) had the most negative impact on the S&P 500, down over 16% for the week
**In January and YTD, Fifth Third Bancorp (FITB) is the worst S&P performer by % loss, down over 71% YTD.
-Google (GOOG) had the most positive impact on the NASDAQ 100, up over 4% for the week.
**In January and YTD, the top NASDAQ 100 performer by % gain is Research in Motion (RIMM), up almost 37% YTD
-Cisco (CSCO) had the most negative impact on the NASDAQ 100, down almost 6% for the week.
**In January and YTD, the worst NASDAQ 100 performer by % gain is Logitech (LOGI), down over 38% YTD
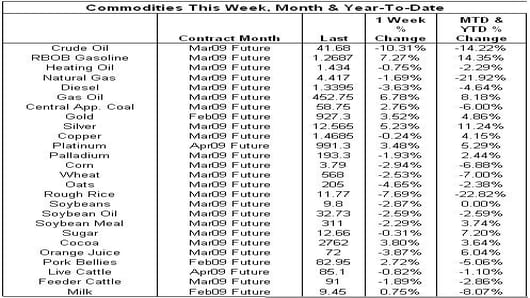
Oil settled at $41.68 per barrel on Friday, while gold rallied to a 4-month high on safe haven plays, settling at $927.3
· Gas Prices: The AAA current national average for regular gas is $1.846 per gallon down 38.18% from a year ago when the average was $2.986 per gallon
-The highest recorded average price by AAA was on 7/17/2008, when the national average was $4.114 per gallon
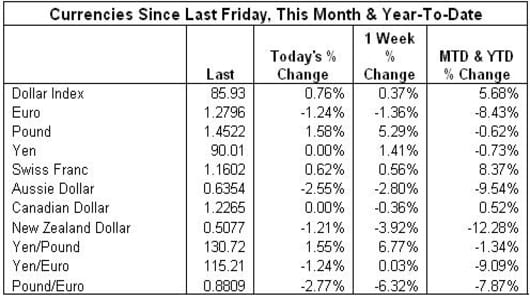
The US dollar may continue its rally against most major currencies next week as another round of interest rate cuts are expected in Britain, Australia and Norway.
-The dollar index is up for the week, and for January and YTD the dollar index has gained almost 6%
Comments? Suggestions? Send them tobythenumbers@cnbc.com
Bythenumbers.cnbc.com
