General Electric, a major manufacturer and lender, continued its decline as the stock, once a stalwart for even the most conservative of portfolios, sold off to levels associated with distressed "fallen angels."
The Dow Jones Industrial Average closed down 299.64 points, or 4.24% percent, to 6763.29, its lowest close since April 25, 1997, and the first close below 7,000 since May 1, 1997. We feel this warrants another look at the DJIA chart.
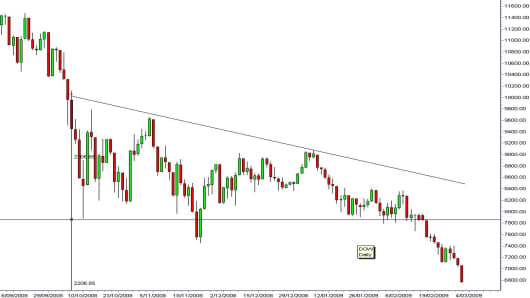
The most dangerous chart pattern in a bear market is the down sloping triangle triangle. This pattern is seen in the Dow Jones Index and it sets a downside target near 5,600. The rapid fall below 7,000 confirms this target objective.
This chart pattern includes a well defined support level near 7,800. Over the last five months the rally rebounds from support near 7,800 have developed a pattern of declining highs. The failure of the early 2009 January rally near 9,000 established a second calculation point for a new down sloping trend line. The first calculation point for the trend line was set by the rally peak near 9,600 in 2008 November.
A new downtrend line is drawn and this creates a down sloping triangle. In a bear market the strength of the pattern is increased. The first feature to measure with this pattern is the height of the triangle. The four day triangle base starts on 2008, October 7, with the drop from near 10,000 to 7,800. The triangle height is around 2,200 points.
Chart pattern analysis provides the most reliable analysis method in this type of market situation. Technical oscillators which measure sentiment in the market are stuck on extreme readings and provide little guidance about trend continuation.
More From CNBC.com
- Dow 6,000; The Next Stop Or Doomsday Talk?
- GE: Staging A General Retreat
- Stocks Hit 12-Year Lows as AIG Rattles Market
- Even Amid Gloom, Stocks May End Year With Gains
Using chart pattern analysis, the downside target for the Dow Jones Index is near 5,600. This target is verified against historical support levels for the Dow. Historically there is a support level near 7,500 but this has been decisively broken.
The long term historical support level is a narrow trading band between 5,500 and 5,600. In a bear market it is the bottom of the trading band that is tested for support.
This combination of factors suggests there is a high probability the market will quickly fall towards support between 5,500 and 5,600. This is a fall of more than 50 percent from the peak of the Index in 2007, October at 14,198. This degree of fall is similar to the degree of fall in 1929 when the America market collapsed and developed the world depression.
The end of this triangle pattern develops near the end of 2009, April. There is a high probability the America market will develop a continuation of the downtrend with a slow move towards support near 5,600. The key feature will be the nature of any consolidation pattern that develops near 5,500 to 5,600.
- Slideshow: Surprising Stock Market Indicators
Failure of genuine support, consolidation and rebound behavior near 5,500 to 5,600 will focus attention in the next support level between 3,700 and 4,000. These remain theoretical targets until the nature of consolidation activity near 5,500 and 5,600 is confirmed. After falls of this degree markets do not develop V-shaped recoveries. They lay down and rest in L-shaped trading consolidation band patterns. Typically these patterns prevail for between four to eight months and offer limited trading opportunities. They are accumulation patterns and investors watch the volume behavior associated with the rallies.
If you would like Daryl to chart a specific stock, commodity or currency, please write to us at ChartingAsia@cnbc.com. We welcome all questions, comments and requests.
CNBC assumes no responsibility for any losses, damages or liability whatsoever suffered or incurred by any person, resulting from or attributable to the use of the information published on this site. User is using this information at his/her sole risk.