

It's the experience every frequent flyer dreads -- the talkative seatmate. This particular gentleman was keen to tell me his opinion of the market and of one stock in particular (it's an absolute screaming buy opportunity!). He quoted a clutch of no-name investment advisory newsletters and chat room pundits who also loved the stock.

I asked him the price he had entered this magical trade opportunity and without pausing to blush, he told me that he had yet to purchase the stock. I was saved from a more biting comment by a steward telling me that my unasked upgrade to business class was now available.
The conversation reminded me of why I am a chartist and why I use technical analysis. It's the reason why I'm still making money in these market conditions.
Three things I want to discuss. The first is objective data. The second is the difference between opinion and conviction. The third is about sharks.
Objective Data
The market provides an opening price, a high, a low, and a closing price on a daily basis. It also generates a volume figure. These are objective measures of price activity and market sentiment. Unlike company accounts, these figures cannot be adjusted, altered, padded, distorted, revised, manipulated or massaged. Price is a verifiable fact available to all market participants at exactly the same time. It forms the foundation of every price chart, and of every technical analysis indicator.
Of course I can always manipulate the price data using a technical indicator to highlight selected relationships, but that's a decision I make and control. And I don't use the manipulated data as my starting point for analysis.
Opinion And Conviction
My chatty would be seat companion highlights the second reason. His opinion was not supported by his money. He didn't have strength of conviction, so although his analysis may be interesting, it is, in the final analysis, literally worthless. There are thousands of opinions floating about the market which people are prepared to back with their own, or borrowed, cold hard cash. The billions of dollars traded everyday are the opinions I want to listen to.
Stock volume is an aggregation of conviction. It encompasses those who are right and those who are wrong, those who are informed and those who are just guessing. But each transaction is belief backed with cash and I respect that courage. When I enter the market I do the same. Chart analysis gives me a way to understand their convictions.
Guppy Amongst Sharks
I am a guppy amongst sharks and to survive, I need to use the skills appropriate to my size. I can't possibly understand a business better than those who are running it. If I did, I'd be a CEO. Then again, in light of recent events, it may not be the most desirable position to be in.
At any one time, I hold five to ten open positions. It's simply impossible to understand the full business details of each of the companies I have interests in. I can't be an accountant, an auditor, a business manager, a product designer and a market strategist.
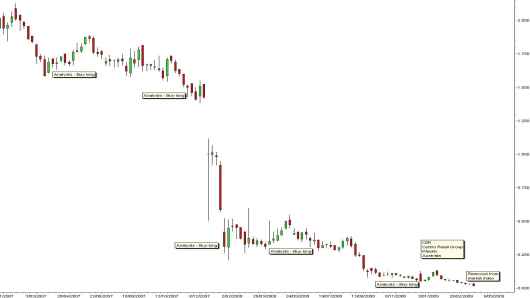
But, I can reasonably expect to look at a chart of price activity and know if the trend is up, down, or sideways. The Centro stock chartis a perfect example of trend analysis in conflict with fundamental analysis. And if I'm in doubt about the trend, I apply the chocolate bar test. I ask my neighbor's 5-year old to look as the chart and tell me if the trend is up or down.
The answer is obvious because he looks only at the trend. 5-year olds don't have Buffett-style preconceptions about company management, the global financial crises, or market share. At the cost of a chocolate bar reward, this method has saved me thousands of dollars by keeping me out of stocks like General Electric , General Motors and Citibank when my broker was telling me they were bargain buys.
More From CNBC.com
- GE: Staging A General Retreat
- Two Strategists: Moves for Long-Term Investors
- Predator or Prey? Chart the Better Deal
- More Asia Pacific News
This starting point trend analysis tells me if I should trade long, short, or stay out of the market. Once that decision is made I select the best tactics and instruments to trade, or invest in the market.
In these market conditions I minimize security risk and time risk by short-term trading of Index derivatives using GMMA Trend Volatility Line analysis. And I remain consistently profitable.
The market price represents the conviction of many people, and of people who are prepared to back their conviction with their own money. I use a price chart to listen to the market and to collect a profit in all market conditions.
If you would like Daryl to chart a specific stock, commodity or currency, please write to us at ChartingAsia@cnbc.com. We welcome all questions, comments and requests.
CNBC assumes no responsibility for any losses, damages or liability whatsoever suffered or incurred by any person, resulting from or attributable to the use of the information published on this site. User is using this information at his/her sole risk.
