

The Nasdaq index has provided consistent leadership in market development since the beginning of the bear market on late 2007. This information is especially useful if you are trading the Dow or the S&P 500, as these indexes follow the Nasdaq with a lag of several days.
This is more than enough time to see the leading action on the Nasdaq and implement a trading strategy on the Dow. This is how we will apply this strategy to catch the NASDAQ by the tail in the next few weeks.
The first question is to decide if this strong uptrend is a rally or a genuine trend. If it's a rally, then we trade with tight stops designed to protect profits in open positions. If it's a long term uptrend then the stops are further away and traders can use the dips to add to existing positions.
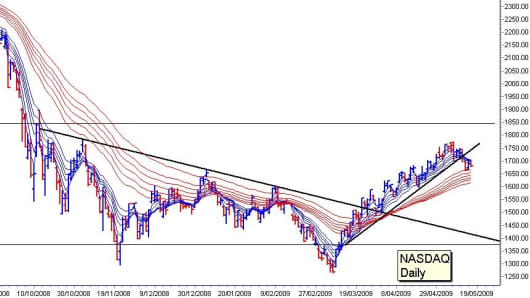
A rebound from support near 1,700 continues the rally. This is a rebound from the short term uptrend line. This has not developed. Trend lines do not have to start at the very pivot point low of the downtrend. The trend line is used to define the behavior of the price activity. The beginning of this trend line intersects the March rise.
There are several features that provide support in this area. The first is the trend line. The second is the lower edge of the short term Guppy Multiple Moving Averages (GMMA) This shows implied support and its failure is important. It has acted as a support and rebound level since the rally breakout commenced. The move below this level signals a change in the nature of the trend.
The fall below the 1,700 level finds the next support level near 1,600. This is the value of the lower edge of the long term GMMA. It's important because this identifies the values where investors are active. The spread in the long term GMMA has good separation and it indicates strong investor buying support. The key test will be the reaction to any price dip below 1,700. Compression in the long term group shows investors have become sellers and major change in the trend is possible.
More From CNBC.com
- Pros Say: Brace For Possible Sideways Correction
- Jim Rogers: Worst For Stocks Yet to Come
- Stock Picker: Ride the Rebound — and Sell in July
If the long-term group does not compress it shows investors are remaining in the market as buyers. They absorb the selling pressure. This is a long-term bullish reaction. It allows the placement of a sustainable long-term uptrend line that is defined by significant retreat and rebound activity. (The difference between a rally and a trendwas discussed in last week's column) A rebound from the lower level of the long-term GMMA suggests a long term uptrend is sustainable. Investors can apply this strategic analysis to the Dow and the S&P with the advantage of several days lead given by the Nasdaq.
And here is the advantage. A fall below 1,600 shows the rally has ended and the long term downtrend has returned with strength. In the Nasdaq this sets a retest of support at 1,400. It sets up a short-side trade in the Dow and the S&P 500 as they follow the lead set by the Nasdaq. The 1,400 level is a long term support level and it is also near the value of the downtrend line that started in October 2008. Using a downtrend line as a support level usually results in a continued slide, in this case towards 1,300.
Watching Nasdaq behavior provides leading clues to the best trading reactions in the markets which follow this lead.
If you would like Daryl to chart a specific stock, commodity or currency, please write to us at ChartingAsia@cnbc.com. We welcome all questions, comments and requests.
CNBC assumes no responsibility for any losses, damages or liability whatsoever suffered or incurred by any person, resulting from or attributable to the use of the information published on this site. User is using this information at his/her sole risk.
