- Dubai Stocks Could Fall a Further 30%: Charts
- Gold Will Collapse Like Oil Did in 2008: Charts
- Dollar Rebound? Wait At Least Another 10 Months
- $1,160 is Gold's Next Target Level: Charts
- Why Nikkei Won't Top 10,500 in Near Term
- MSFT Stock Rise Has Little to Do with Windows 7
- What Now for Dow? Look to China for Clues
- How Far will Asia Go? Look to Kospi, Not Dow
- Betting on Aussie Parity With Dollar? Don't Hold Your Breath
MOST SHARED
- Good Sign for the Economy: 'Greed' Makes a Comeback
- Dubai Stocks Could Fall a Further 30%: Charts
- Timeless and Time-Tested Warren Buffett Watch Predictions
- Bank of Japan Offers More Liquidity at Emergency Meeting
- Dubai Markets Close Sharply Lower for Second Day
- Manufacturing in Focus as Bulls Call for Turn in Dollar
- Treasury Threatens Banks, Not Borrowers
- What to Expect from Cyber Monday
- Dubai World Set to Restructure About $26 Billion of Total Debt
- Bove: 26 Banks May Need To Raise More Capital
- How Long Will This Health Care Firm's Rally Last?
- Dubai a 'Wake Up Call'—Expect Volatility Now: Market Pro
- Treasury Threatens Banks, Not Borrowers
- We're Approaching a Market Bubble: Portfolio Manager
- Hershey Shares: What Options Are Saying
- Nov. 30: Unusual Volume Leaders
- Why Careful Shoppers Are Great for the Box Office
- Blue Nile CEO: 'We're Having the Best Cyber Monday Ever'
- Best Online Retailers to Buy Now: Internet Analyst
- Trump: Time to Force Banks to Start Lending
- More Late on Auto Loan Payments in Third Quarter
- Treasury to Sell 12.7 Million Capital One Warrants
- Contagion Fears Calmed by Dubai World Plan
- AIG Cuts Debt to Government by $25 Billion; Shares Up
- GM Sees China Sales Soar 110% in November
- China Hires Foreigners to Manage Forex Reserves
- Bank of Japan Offers Liquidity at Emergency Meeting
- Somali Sea Gangs Create Pirate Stock Exchange
RSS FEED
Charting Asia
Gold has enjoyed a good run up the past 12 months, and this is mainly due to uncertainty in equity markets (have we reached a bottom yet?) and the oil rally in May. Is there still more upside potential in bullion?
Gold is moving towards resistance at $1,000. The gold price shown on the NYMEX weekly Gold chart has several interesting features. The short-term uptrend is defined by line B and this is used for trade management.
![]() |
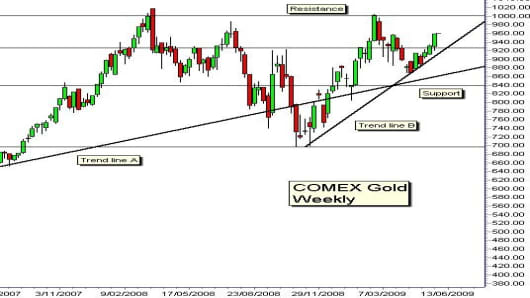
The rise in gold was dominated by a long-term uptrend. The long-term uptrend line A starts in July 2005, and uses the lows during June 2007 as the second point for the position of the trend line. This long-term trend was broken in October 2008, and many people believed this was a signal for a new long term downtrend. They were wrong — support and resistance defines the character of this market.
The most important trend breakout developed in September 2007, when the price moved above $690. This level had been a very powerful long-term resistance level. It wasn't surprising when the market retested the $690 level in 2008 and used this as a support and rebound level.
The location of support and resistance levels is an important feature that defines the price activity. The rebound from support near $690 in November 2008 was very rapid and the price moved above the long-term uptrend line in December 2008. This rise meant the long-term uptrend that had started in July, 2005, was again the most important support level for the uptrend.
Horizontal support and resistance levels had developed near $840 and $930. The strongest resistance level is near $1,000. The $840 level was a weak resistance level in 2007 and it has been a middle point consolidation level in 2008. This combination of long term uptrend line and support and resistance levels defines the way the trend will move towards resistance at $1,000.
The combination of resistance near $690 and the long-term trend line in 2005 to 2007 created an up sloping triangle pattern. The target for this chart pattern is $930. This level has acted as a new resistance level several times since the end of 2007. A move above the $930 level is bullish and establishes the condition necessary for a strong rally towards $1,000.
More From CNBC.com
- Dorn: Playing Gold & Gold Stocks
- Art Cashin: I'm 'Worried' About Treasury Auction
- Oil, Gold, NatGas: Worldwide Prices
A retreat from the $930 area can test support from the long term uptrend line. This support is currently near $865. The level of this support continues to rise as the up trend line develops. This increases the upwards pressure on the price and increases the probability of a successful rally to resistance at $1,000.
A successful breakout above $1,000 has a first target near $1,150 and a long-term target near $1,300. These price levels may take many months to achieve. Traders watch for price to move above or below the significant trend line and support/resistance levels before they take action.
If you would like Daryl to chart a specific stock, commodity or currency, please write to us at . We welcome all questions, comments and requests.
CNBC assumes no responsibility for any losses, damages or liability whatsoever suffered or incurred by any person, resulting from or attributable to the use of the information published on this site. User is using this information at his/her sole risk.
- To improve its public image, Goldman Sachs has forbidden employees to attend private parties of 12 or more.
- Since its launch in 1998, Google has become a primary force on the Internet. How much do you know about the company?
- What do the gifts from the 12 Days of Christmas cost this year, and how do they compare to 2008?
- Raising alligators is hard work, and the fickle taste of rich consumers has just made it much harder, says the NY Times.
- A recent issue of ESPN Magazine was one of its top sellers ever, and it only took scantily clad athletes to make it happen.
- The continued real estate boom in China is partially fueled by a generational flood of newlyweds.


