Skip navigation

Realty Check

#DIANAOLICK ON TWITTER


Current DateTime: 07:38:58 11 Feb 2012
LinksList Documentid: 23279692
Expiration DateTime: 2/11/2012 7:39:52 AM

Current DateTime: 07:38:58 11 Feb 2012
LinksList Documentid: 35933407
  • The 10 Emptiest US Cities

      It’s no secret that the U.S. housing market has seen better days. So, what are the emptiest major U.S. cities?

  • Most Expensive States

      Your dollar won't get as far in these ten states. Which states are the most expensive to live in?

  • Inspired Homes

      From the Simpsons TV show, to the White House to Snow White, here are homes inspired by others.

MOST SHARED


Current DateTime: 07:38:58 11 Feb 2012
LinksList Documentid: 31330905
Expiration DateTime: 2/11/2012 7:39:45 AM

Current DateTime: 07:38:58 11 Feb 2012
LinksList Documentid: 23452000
Expiration DateTime: 2/11/2012 7:39:40 AM

Current DateTime: 07:38:58 11 Feb 2012
LinksList Documentid: 23452764
Expiration DateTime: 2/11/2012 7:39:24 AM

REALTY CHECK VIDEO

» More

Current DateTime: 07:39:00 11 Feb 2012
LinksList Documentid: 30871294
Expiration DateTime: 2/11/2012 7:42:34 AM

RSS FEED

» Help

Current DateTime: 07:39:02 11 Feb 2012
LinksList Documentid: 30871303

Home Prices: Are We There Yet?

Published: Tuesday, 30 Jun 2009 | 3:50 PM ET
Text Size
By: Diana Olick
CNBC Real Estate Reporter

A lot of folks are parsing the latest S&P Case Shiller home price report out today, and debating whether some month-to-month increases are proof of home price stabilization nationwide. I frankly think it’s impossible to say anything nationwide, because a lot of different markets are reacting very differently. That may seem an incredibly prosaic thing to say, but I think an awful lot of smart folks often lose sight of that.

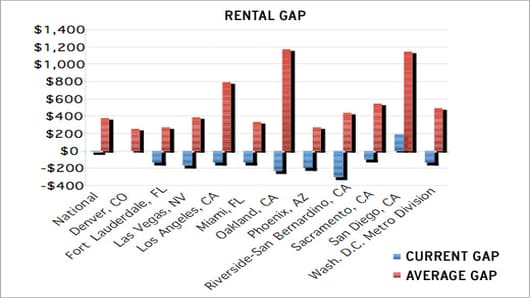
I want to focus today on a couple of charts I got from John Burns over at John Burns Real Estate Consulting. He chooses to look at affordability and the Rental Gap (that is how much more or less it costs to own versus to rent) as better indicators of price direction.

First, take a look at the Rental gap:

Rental Gap

As you can see, it is now far more economical to own in many of the formerly hot markets than it is to rent. “We're seeing payments now that are the best they've been since we've been tracking this and we've been tracking this since 1981,” says John Burns. “So all those people who maybe missed out on the boom couldn’t afford to buy a home when prices were what they were in 2005 can now get in and buy a home.”

Now look at affordability. This is a tricky chart, but fascinating:

Housing Costs

Questions?  Comments? 

© 2012 CNBC, Inc. All Rights Reserved


Current DateTime: 09:37:11 10 Feb 2012
LinksList Documentid: 29778428

Current DateTime: 02:33:42 10 Feb 2012
LinksList Documentid: 29779196

Current DateTime: 11:35:14 10 Feb 2012
LinksList Documentid: 29779197

Current DateTime: 02:56:31 10 Feb 2012
LinksList Documentid: 29779199
CNBCCNBC
About CNBC  |  Site Map  |  Video Reprints   |  Advertise  |  Help  |  Contact
Privacy Policy  |     |  Terms of Service  |  Independent Programming Report
  Data is a real-time snapshot  *Data is delayed at least 15 minutes
Global Business and Financial News, Stock Quotes, and Market Data and Analysis

© 2012 CNBC LLC.  All Rights Reserved.
A Division of NBCUniversal
Thomson ReutersThomson Reuters