Why Nikkei Won't Top 10,500 in Near Term

Japan's benchmark stock index the Nikkei Average fell below the 10,000-level for the first time in three weeks last week, and has since had little success maintaining its upward momentum.

From a chartist's point of view, the index will continue to struggle in the near term.

The Nikkei has a similar behavior to the Korean KOSPI Index, which I've explained in an earlier blog, defines the pattern of market recovery behavior in Asia.

GUPPY 0311.jpg

It starts with the consolidation band that developed between September 2008 and May 2009. The band is not well defined. It has broad support near 7500. It has broad resistance near 9000. Each of these levels has been pierced by weekly highs or lows. However it’s a broad pattern of support and resistance that aligns with previous historical levels.

The width of the trading band is measured and this value is projected upwards. This sets the first upside target for any breakout. As the KOSPI chart shows, this trading band projection can be doubled and tripled. Each new projection provides a good indication of the next target and resistance levels.

Unlike other regional markets, the Nikkei has struggled to reach the first upside projection target near 10500. This has partly been because the long term downtrend line starting October 2007 has provided a strong resistance barrier near the 10,000 level.

The breakout above this resistance trend line was unconvincing. The breakout struggled to stay above the 10500 trading band projection level. Had it been able to use this level as support then the next upside target would be near 11,700 which is just below the very strong historical resistance level near 12250. Both these remain distant targets.

nikkei.jpg

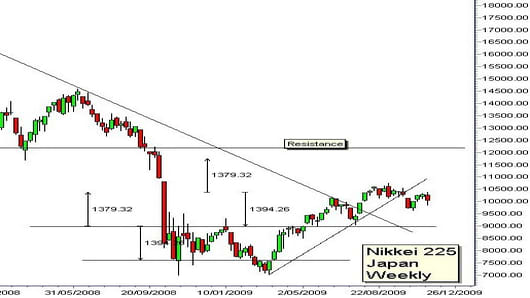
There is now a high probability the market will trade in a consolidation pattern between support near 9000 and resistance near 10500. Support near 9000 is well defined so there is a low probability the market will drop below this. If this does happen, then the next downside target is near the support level at 7500.

The Nikkei shows an truncated pattern of trend breakout, recovery, consolidation and trend failure. Other regional markets follow the same behavioral pattern, but they have shown much more vigor. They have achieved trading and projection targets two to four times the height of the original trading band.

The Nikkei 225 has become the old man of the region. It follows other markets, but at a much slower pace.

If you would like Daryl to chart a specific stock, commodity or currency, please write to us at ChartingAsia@cnbc.com. We welcome all questions, comments and requests.

CNBC assumes no responsibility for any losses, damages or liability whatsoever suffered or incurred by any person, resulting from or attributable to the use of the information published on this site. User is using this information at his/her sole risk.