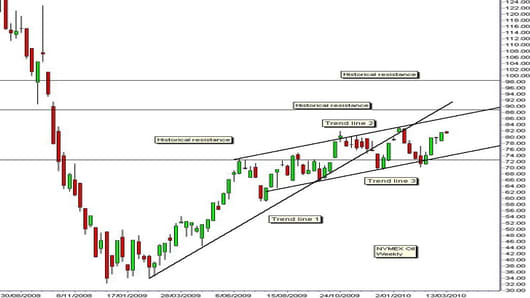
The first important feature, highlighted by the long-term uptrend line 1, started with a rally in the price from February to October 2009. During this time, line 1 acted as a 'support' feature. However, the nature of the line changed to a 'resistance' feature in December when the price fell below the line.
The second important feature is the upward sloping trading channel. In the short term, the oil price rally and retreat behavior is defined by the upper and lower edges of the trading channel. The upper edge of the trading channel starts from the high at $73 in June 2009. Trend line 2 is a resistance level.
The lower edge of the trading channel, trend line 3, starts from near $65 in 2009 July. This line touches the lows at $66, $69 and $71. The position of the line is not exact but the trading channel captures the bullish pressure in the oil price.
If this develops over a relatively short time frame the pattern would be called a typhoon flag. Just like a flag buffeted by strong typhoon winds, the flag slopes upwards above the top of the flagpole. This is not a bearish pattern, rather, it's a trend continuation pattern.
The typhoon flag is confirmed when the lower edge of the up sloping channel is above the high of the initial flagpole, demonstrated in this chart by trend line 3, shown here to be well above $72, the high for the first 2009 price rise peak.
The upward sloping trading channel is a strong bullish feature for oil.
The third important feature on the weekly chart is the strong historical resistance level near $88. This is the mid-year upside target for oil. The bullish environment for oil is confirmed when the oil price retreats to the historical support level near $78 and uses this for a rebound rally.
This historical support level is also the value of the lower edge of the typhoon flag shown by trend line 3. This rebound is a very bullish signal and will allow prices to move very quickly towards $88 or higher. A sustained move above $88 has an upside target near $98. The current rate of trading band momentum makes this target achievable towards the end of 2010.
Confirmation of the typhoon flag, and the strength of the upward sloping trading channel suggests suggests a steady increase in oil prices with sharp rallies and retreats within a bullish trading channel.
Daryl Guppy is a trader and author of Trend Trading, The 36 Strategies of the Chinese for Financial Traders –www.guppytraders.com. He is a regular guest on CNBCAsia Squawk Box. He is a speaker at trading conferences in China, Asia, Australia and Europe.
If you would like Daryl to chart a specific stock, commodity or currency, please write to us at ChartingAsia@cnbc.com. We welcome all questions, comments and requests.
CNBC assumes no responsibility for any losses, damages or liability whatsoever suffered or incurred by any person, resulting from or attributable to the use of the information published on this site. User is using this information at his/her sole risk.