A Technical Look at These ‘Wild’ Markets

“This market is wild. It’s crazy,” Cramer said during Tuesday’s Mad Money. “And it’s controlled by the S&P futures.”

These futures are where the biggest fund managers invest their money, and such a large amount of cash is being thrown around that they can push and pull the market in either direction. Another thing about these market pros: They’re constantly consulting the charts. So if you want an idea of what’s driving managers’ decision making, Cramer thinks it’s best to look at a chart of the SPDR S&P 500, an exchange-trade fund that tracks that bellwether index.

In the S&P’s daily chart, three things stand out, Cramer said, “and they’re all negatives.” First, the biggest volume over the last month has been to the downside, which means those fund managers have been doing more selling than buying.

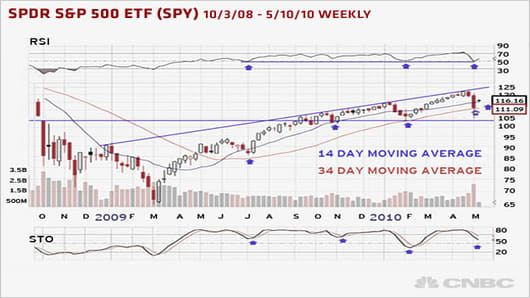
Second, notice at the top of the chart the relative strength index, or RSI, which measures how overbought or oversold a stock is. In this chart the relative strength of the S&P’s move up looks very weak because it was unable to break through the downtrend channel in the RSI. In technical analysis, that could mean the S&P stays oversold for a while without a snap back.

But “the ugliest thing of all about this chart,” Cramer said, is that the 14-day moving average of the S&P has just crossed below its 34-day moving average. That’s called a bearish crossover, and it means the index’s short-term trajectory is now worse than its more medium-term trajectory. That happened last in January, and it resulted in several weeks of rest for the S&P.

Early March saw a reverse, though, called a bullish crossover, where the 14-day moving average moved back above the 34-day. Then the S&P spent the next six weeks heading higher. Given that this pattern is time-tested, one of Cramer’s preferred chartists thinks that the 14-day now will act as resistance, meaning that over the short term he doesn’t see the SPY passing $118, or 1,180 for the S&P.

The weekly chart, however, looks a bit more positive. Since July 2009, the three best buying opportunities have been when the S&P has broken below its 14-week moving average but held the 34-week moving average. And each time, the RSI held at the midpoint level – meaning not too hot or cold – and the first two times the stochastic oscillator – it’s down at the bottom of the chart and, like the RSI, measures if a stock or index is overbought or oversold – turned positive.

MM_spider_sp_chart_weekly.jpg

While the S&P isn’t quite there yet, the aforementioned chartist thinks these conditions may develop over the next two weeks if the daily chart produces a more range-bound market. And that would be a great buying opportunity.

So what’s the entry point for the SPY? That chartist said $111, especially because the long-term resistance line in the weekly indicates the ETF could move up to $125, or 1,250 on the S&P 500 over the next three to six months.

In general, that gain is something that Cramer, who prefers the fundamentals over technical analysis, believes in, too. Now that the European contagion has been taken off the table, he’s much more bullish about this market than the technicians seem to be. But he did want to show via the charts what the big money was thinking. As to who’s right, that remains to be seen.

“I trust the fundamentals, big money trusts the charts,” Cramer said. “May the best indicator win.”

Call Cramer: 1-800-743-CNBC

Questions for Cramer? madmoney@cnbc.com

Questions, comments, suggestions for the Mad Money website? madcap@cnbc.com