

The world environment has a crisis in Japan and a crisis in the Middle East. In this situation, it is common for many investors and traders to buy more gold This has not happened. The price of gold on the COMEX gold chart has fallen from $1440/oz to near $1420/oz.
Is this weakness a buying opportunity or is this weakness an indication that the uptrend in gold has become weaker?
There are several indication of trend weakness. This does not mean a new long-term downtrend will develop in gold. This trend weakness suggests it will be more difficult for gold to move above $1440/oz and continue with an uptrend at the same speed as the trend rise from $1320/oz to $1440/oz.
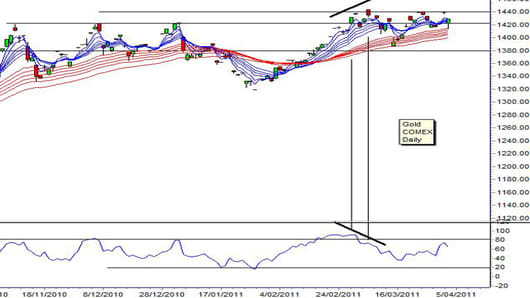
The first indication of the decline in trend momentum is the weak breakout above the triple top resistance level at $1420/oz. The $1420/oz level was tested as resistance in 2010 -November 9, December 10 and December 31. When the breakout above $1420/oz developed on March 1, 2011, the breakout was weak. It was followed by a major retreat to $1390/oz. The second move above resistance at $1420/oz on March 4 2011 has also been followed by a retreat.
The second indication of momentum weakness is the double top resistance pattern that has developed near $1440/oz on March 2 and March 23, 2011. This creates a consolidation resistance band between $1420/oz and $1440/oz. This consolidation band makes it more difficult for the market to move above $1440/oz and resume a strong uptrend.
The first and second features suggest gold may develop a sideways consolidation pattern trading between $1390/oz and $1440/oz.
The third feature is created by the Relative Strength Indicator(RSI). This is a weak RSI divergence signal. This signal is created when the direction of the price trend is the opposite to the direction of the trend on the RSI indicator. The trend direction on the gold price chart from the high on March 2 to the next high on March 7 is up. The trend direction for the RSI indicator from March 2 to March 7 is down. This creates an RSI divergence signal.
A strong RSI divergence is a warning of trend weakness and it often indicates a significant change in the trend. A strong signal is generated when there is one peak in price followed by several days of a price retreat, and then a rally with a new high, which again is followed by a retreat. This creates a pattern similar to two mountain peaks separated by a valley.
The pattern with the gold price is not separated by a strong retreat and rally rebound. The price peaks are near to each other and this makes the RSI divergence signal weak. The RSI divergence signal confirms a slowing of momentum in the gold price. Traders will use caution until the uptrend is confirmed with a strong breakout above $1440/oz.
Daryl Guppy is a trader and author of Trend Trading, The 36 Strategies of the Chinese for Financial Traders –www.guppytraders.comand producer of Gold – Mining the Markets. He is a regular guest on CNBC's Asia Squawk Box. He is a speaker at trading conferences in China, Asia, Australia and Europe.
If you would like Daryl to chart a specific stock, commodity or currency, please write to us at ChartingAsia@cnbc.com. We welcome all questions, comments and requests.
CNBC assumes no responsibility for any losses, damages or liability whatsoever suffered or incurred by any person, resulting from or attributable to the use of the information published on this site. User is using this information at his/her sole risk.
