

Oil remains on a bull run. The fall from near $114/barrel to below $100/barrel is a correction, but not a change in the trend. This behavior sets a higher price target for oil as the uptrend continues.
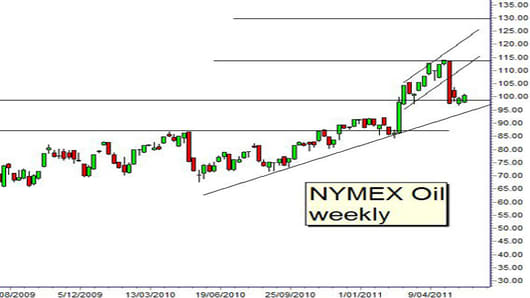
Chart and technical analysis identify significant trending features. It starts with the typhoon flag pattern that developed after the fast rise in the oil price from $86/barrel to $105/barrel.
The typhoon flag is an upward sloping flag pattern and is a trend continuation pattern.
This typhoon pattern often ends with a sudden price retreat and Bin Laden’s death was enough to create these conditions. The sell signal for this pattern was the move below the lower edge of the flag trend line near $109/barrel. This signaled a rapid fall in oil prices, but this does not mean prices develop a new downtrend.
The typhoon flag pattern developed a resistance level near $114/barrel and this is used in later analysis for the calculation of new upside oil price targets.
The oil price retreated below the psychologically important level of $100/barrel to the technical support level near $98/barrel. The $100/barrel level is important psychologically but the pattern of support and resistance trading bands below $100/barrel confirms $98/barrel as the more significant technical support level.
These retreats take place in the context of continued strength of the long-term uptrend in oil. The uptrend in oil started in September 2010 and the uptrend line was confirmed with the retreat and rebound of price in February 2011. This up trend line has a current value near $94/barrel. Oil could fall to $94/barrel and still remain consistent with the long-term uptrend.
Oil trades between consistent support and resistance bands.
The retreat from new resistance near $114/barrel to support near $98/barrel has created a new trading band $16 wide. This is considerably larger than the trading band behavior when oil is below $100/barrel.
When oil is trading below $100/barrel the trading bands are around $10 wide. When oil moves above $100/barrel the behavior of the market changes with an increase in volatility. The trading bandwidth has increased to $16.
The first upside target for a rebound from $98/barrel is at $114/barrel. A breakout above $114/barrel has a technical upside target near $130/barrel. This is higher than previous technical calculation because the width of the new trading band is larger.
In the short term the oil price will hover around $98/barrel to $100/barrel with the potential to dip towards $94/barrel. This is a breather in the trend. A continued sideways drift in price will hit the uptrend line in late August and create the technical conditions for another rapid rally in prices.
The longer term up trend pressure on oil prices remains consistent. The move towards the first resistance target near $114/barrel may be slower in coming weeks but the upward pressure remains strong. The expansion of the width of the trading band has increased the upside target following a successful breakout above $114/barrel.
Despite the short-term relief with falling oil prices, the NYMEX oil chartshows continued bullish pressure.
Daryl Guppy is a trader and author of Trend Trading, The 36 Strategies of the Chinese for Financial Traders –www.guppytraders.com. He is a regular guest on CNBC's Asia Squawk Box. He is a speaker at trading conferences in China, Asia, Australia and Europe.
If you would like Daryl to chart a specific stock, commodity or currency, please write to us at ChartingAsia@cnbc.com.
CNBC assumes no responsibility for any losses, damages or liability whatsoever suffered or incurred by any person, resulting from or attributable to the use of the information published on this site. User is using this information at his/her sole risk.
