

The movement in the copper price is used as a leading indicator of economic development because it reacts more quickly to changes in industrial demand. Several other industrial metals also react quickly to changes in demand, and this includes tin and nickel. Tin is used in many manufacturing processes. Nickel is an additive to more advanced metal production.
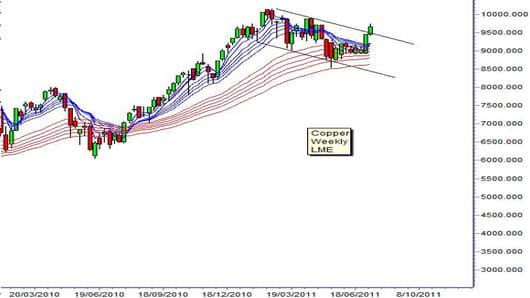
In April 2011 the London Metal Exchange copper price activity developed a small head and shoulder pattern. This is usually an up trend reversal pattern. This small pattern suggested a retreat in the copper price, but not a significant change in the trend. The downside target for this pattern was near $8,300 per metric ton. The pattern failed to develop fully and the price fell to a low of $8,550 before rebounding.
The copperprice rebounded and developed a small consolidation with resistance near $9,200. The last two weeks have seen a powerful rally above the $9,200 resistance level. This is also a break above the short-term downtrend line. This signals a continuation of the uptrend. It also signals a resurgence of economic growth.
The failure of the head and shoulder pattern is confirmed with a price move above $9,800. This is the value of the high of the right shoulder of the pattern.
The strength of the long-term up trend is confirmed with the behavior of the long-term group of averages in theGuppy Multiple Moving Average (GMMA) indicator. This indicator tracks the behavior of investors and the behavior of traders. The long term GMMA did not compress significantly when the copper price fell from $10,100 to $8,500. This indicated that investors were buyers in the market. They used the weakness in the copper price as an opportunity to buy more contracts at favorable prices because they believed the long-term price would be higher.
If the long-term GMMA had developed significant compression it would show investors had become sellers, and this would have contributed to a stronger downtrend development.
The initial upside resistance target for copper is near the previous high at $10,100. Currently there is no price or chart pattern development that allows for the calculation of the upside target above $10,100.
The small support resistance level near $9,200 provides a limited guide to the breakout above $10,100. This suggests an upside target near $11,000. The $11,000 target is used as a guide. It is confirmed with the development of new price activity as the market moves towards $10,100.
This same style of trend breakout pressure is also seen with the Nickel price traded on the London Metals Exchange. This is a strong breakout from the downtrend and has a resistance target near $25,000 per ton, up from the current $23,500 level.
The tin price traded on the London Metals Exchange is in the early development stages of a parabolic up trend with initial target around $30,000 a ton, up from the current $27,500 level.
The upward pressure in these associated industrial metals gives an early indication of a stronger global economic recovery but these charts do not provide an indication of the location of the recovery.
Daryl Guppy is a trader and author of Trend Trading, The 36 Strategies of the Chinese for Financial Traders –www.guppytraders.com. He is a regular guest on CNBC's Asia Squawk Box. He is a speaker at trading conferences in China, Asia, Australia and Europe.
If you would like Daryl to chart a specific stock, commodity or currency, please write to us at ChartingAsia@cnbc.com.
CNBC assumes no responsibility for any losses, damages or liability whatsoever suffered or incurred by any person, resulting from or attributable to the use of the information published on this site. User is using this information at his/her sole risk.
