

Not many traders believe that the more than 10 percent rally since Oct. 3 is really predicting a bigger and betterEuropean recapitalization plan or a reacceleration in the U.S. economy. Many believe it is simply a move within a new trading range that will last until the end of the year.

AP
NYSE traders
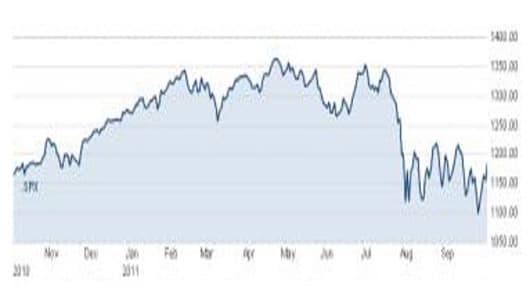
The S&P 500 bounced within a six percent range for about seven months to start the year. Investors made money if they bought the S&P 500 at about 1260 and sold the benchmark at around 1340.
After a dramatic August selloff, a new range has been established for traders to play in, they said. Buy the S&P 500 at around 1120 and sell it at 1220.
“Driving such sideways trading is the up and down economic data that keeps the U.S. teetering between a recession and a recovery and continued uncertainty around the euro-crisis with the Merkel/Sarkozy pledge to stop the banking and sovereign debt crisis in Europe without offering details, providing a perfect example of why uncertainty lingers,” said Abigail Doolittle, a technical analyst with Peak Theories.
Further undermining the long-term validity of this rally is that the exact same stocks that were sold the most during the recent drop from the top of this new range to the bottom of it are the ones that are up the most in this latest comeback.
“The 50 stocks that held up the best during the correction have averaged a gain of just 3.76% since 10/3 (the worst of any decile), while the 50 stocks that were crushed the most during the correction are up an average of 17.01% (the best of any decile),” wrote Bespoke Investment Group analysts, in a note to clients. “Clearly investors thought that the sell-off became overdone, and they were happy to buy the stocks that got beat up the most.”
What’s more, the stocks that had the most investors betting against them, are also leading this latest comeback. A trademark short-covering rally, traders said.
“The 50 stocks with the smallest amounts of short interest are up an average of 7.88%, while the 50 stocks with the highest short interest are up an average of 12.16%” since Oct. 3, according to Bespoke.
“The market was due for a rally on merit, however, the velocity of the rally is what we can blame on short covering,” said Jim Iuorio of TJM Institutional Services. “We have merely gone from the lower end of a trading range to the upper end of that range.”
For the best market insight, catch 'Fast Money' each night at 5pm ET, and the ‘Halftime Report’ each afternoon at 12:30 ET on CNBC.
______________________________________________________
Got something to say? Send us an e-mail at fastmoney-web@cnbc.com and your comment might be posted on the Rapid Recap! If you'd prefer to make a comment, but not have it published on our Web site, send your message to fastmoney@cnbc.com.
