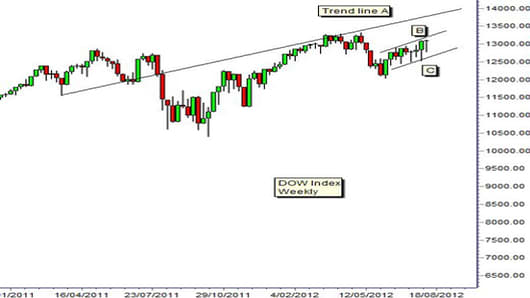
This neck trend line is projected forward into the future and it has provided a strong resistance feature. During 2012 March the DOW reached this trend line resistance level and then retreated. This suggests trend line A will continue to play an important resistance role in the future.
In recent weeks the DOW has developed a small up sloping trend channel. This is defined by trend line B and C. This channel runs parallel to trend line A. The current DOW index activity is trapped within the trading band and this gives rally and retreat behavior within the environment of a longer term up trend movement.
Trend line B is clearly defined and easy to place along multiple high points on the weekly chart. In placing trend line C we have tried to capture the bulk of the trading activity low points. Trend line C is also parallel to trend line B. Many investors are buying when the DOW retreats and tests the support level provided by trend line C.
In the short term this trading channel pattern places a limit on the ability of the DOW to move quickly upwards. The up trend is constrained by the resistance indicated by trend line B.
In the longer term any breakout above trend line B is limited by the very strong resistance features of trend line A. The DOW is best suited to a volatility based approach.
The trend pattern in the DOW is different to the trend pattern in the broader S&P 500 index . The S&P trend is well defined with the Guppy Multiple Moving Average. The long term group of averages have wide separation and shows investors are buying.
The DOW up trend has resistance created by trend line A and B. The S&P uses the GMMA as a support level in a rising trend. The DOW is bullish, but not as strongly bullish as the S&P.
Daryl Guppy is a trader and author of Trend Trading, The 36 Strategies of the Chinese for Financial Traders –www.guppytraders.com. He is a regular guest on CNBC's Asia Squawk Box. He is a speaker at trading conferences in China, Asia, Australia and Europe.
If you would like Daryl to chart a specific stock, commodity or currency, please write to us at ChartingAsia@cnbc.com. We welcome all questions, comments and requests.
CNBC assumes no responsibility for any losses, damages or liability whatsoever suffered or incurred by any person, resulting from or attributable to the use of the information published on this site. User is using this information at his/her sole risk.