However, there is a second group of features which impose both a new resistance level and also offer the promise of a long term trend reversal. This is the fan pattern that starts from the 2008 August highs near 110 yen.
The fan pattern consists of a series of trend lines, all starting from the same high point. These lines first act as a support level, and then later as a resistance level. The price activity is contained between these trend lines. When a breakout occurs the rally is capped and this creates the location point of a higher trend line.
A fan pattern develops as a trend starts to change direction. It is most commonly seen in a downtrend. The pattern occurs when prices are re-valued upwards, but the direction of the trend does not change. This appears on the chart as a shift sideways. The old resistance level acts as a new support level. The new resistance level does not run parallel to the old support level.
Instead it broadens away in an expanding wedge. As price action moves horizontally in time the price uses the new resistance line as a limit area. A break above this is often decisive, making a new high before pulling back to use the old resistance level as a new support level.
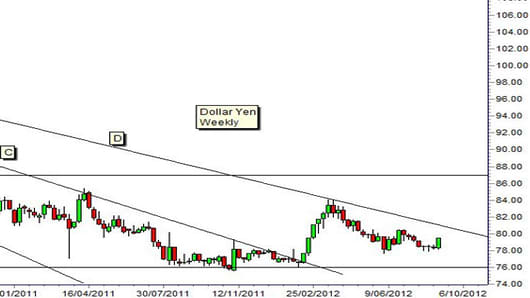
The breakout above the trend line C on the chart in 2011 February quickly moved to resistance near 84 yen before retreating. This peak at 84 yen provides the second anchor point for trend line D. The current value is near 80 yen. A breakout above trend line D is very bullish even though classic resistance is near 84 yen.
It’s very bullish because the fan pattern reversal is typically a very long term pattern. It may take six months to a year to fully develop. Usually it has three to four sections of the fan. The dollar/yen chart shows three fan sections so the balance of probability favors a successful rally towards 85 yen with a breakout above 80 yen.
The key indicator of long term success and a trend change is a retreat following the breakout that uses the upper downtrend line D as a support level. This behavior would confirm the development of a new uptrend in the dollar/yen chart.
In the short term this is a rally and retreat environment moving towards historical resistance. In the longer term this is the late stages of a developing fan pattern trend reversal.
Daryl Guppy is a trader and author of Trend Trading, The 36 Strategies of the Chinese for Financial Traders –www.guppytraders.com. He is a regular guest on CNBCAsia Squawk Box. He is a speaker at trading conferences in China, Asia, Australia and Europe.
If you would like Daryl to chart a specific stock, commodity or currency, please write to us at ChartingAsia@cnbc.com. We welcome all questions, comments and requests.
CNBC assumes no responsibility for any losses, damages or liability whatsoever suffered or incurred by any person, resulting from or attributable to the use of the information published on this site. User is using this information at his/her sole risk.