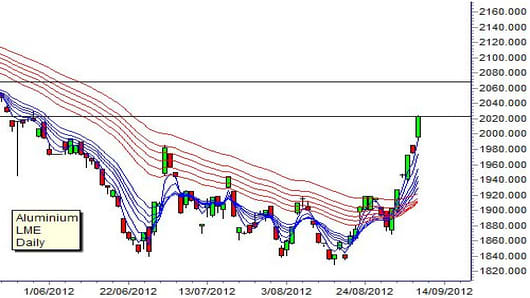
The same applies to the long term group of averages, but investors are slower to change their opinion. The GMMA on the chart shows the classic pattern of test and retest of the strength of the downtrend. Each time the short term GMMA moves deeper into the long term GMMA, setting up the conditions for a breakout.
The power and stability of the breakout is confirmed when the long term GMMA compresses showing investor agreement on value and price. This happens quickly, and the long term group is now moving upwards. This shows a change in investor opinion.
The key test will be when the rally for LME aluminum retreats from initial resistance near $2,020 per tonne and retests support near $1,930. This is also the value of the upper edge of the long term GMMA. A move above $2,020 has upside target near $2,070.
The second feature is the triple bottom that developed between June and August. This is a powerful reversal feature that added to the probability of a sustainable breakout. This is an end of downtrend consolidation pattern, developing just at the time when many people were calling for a downtrend continuation in commodity prices.
The third feature is the broad consolidation pattern that developed as the market moved sideways. The width of the consolidation pattern is measured, and the value projected upwards to give the first breakout targets. This projection gives a target near $2,020. This combination of projection targets and historical resistance suggests this level will act as a retreat feature.
However, the strength of the GMMA breakout suggests that any retreat is an entry opportunity for traders who want to take long side positions in anticipation of the trend continuation.
Not every metal traded on the LME shows exactly the same behavior. However the GMMA relationships are repeated and they confirm a commodity rebound. The sustainability of the rebound is unknown, but the change in the behavior of the long term GMMA – in investors’ expectations – suggest a sustainable trend breakout.
Daryl Guppy is a trader and author of Trend Trading, The 36 Strategies of the Chinese for Financial Traders –www.guppytraders.com. He is a regular guest on CNBC's Asia Squawk Box. He is a speaker at trading conferences in China, Asia, Australia and Europe.
If you would like Daryl to chart a specific stock, commodity or currency, please write to us at ChartingAsia@cnbc.com. We welcome all questions, comments and requests.
CNBC assumes no responsibility for any losses, damages or liability whatsoever suffered or incurred by any person, resulting from or attributable to the use of the information published on this site. User is using this information at his/her sole risk.