Gayed: How to Track Market Sentiment on the ‘Fiscal Cliff’

Wall Street Casts Its Vote: 'The Market Is Going Down'
Joel Carillet | Getty Images

"Public sentiment is everything. With public sentiment, nothing can fail. Without it, nothing can succeed." - Abraham Lincoln

Every single day that goes by, the U.S. gets closer and closer to the dreaded "fiscal cliff," which would result in tax increases and spending cuts at a time when many would argue the economy is just one bad quarter away from another recession. Are such fears warranted now that Obama has won a second term? Maybe, maybe not.

Predictions are often meaningless unless one is actually betting on a particular prediction becoming reality. Fortunately, when it comes to markets, we can see this real-time through the behavior of price. (Read More: Round 1 - Traders Watch Sandy's Impact and Ding! 'Fiscal Cliff')

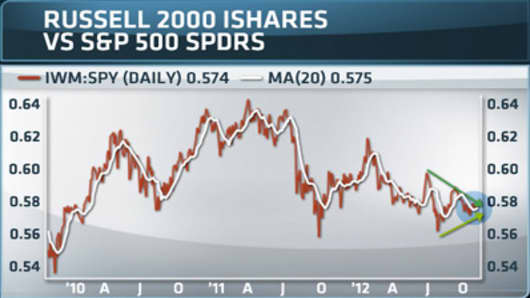
How can one possibly gauge what the market thinks the odds are of the fiscal cliff either 1) happening, or 2) happening and not being that damaging? It is actually fairly simple — track the performance of those areas of the stock market most sensitive to a domestic shock to gross domestic product (GDP) and revenue growth. (Read More: Fiscal Cliff - CNBC's Complete Coverage)

In the world of equities, it is small-cap stocks that are most dependent upon the U.S. economy. After all, large-cap stocks in the S&P 500, for example, derive a meaningful amount of revenue fundamentally from overseas buyers. (Read More: Prescriptions for America)

This should make sense given that almost by definition, larger companies have more resources and are thus capable of expanding across our borders as opposed to less-well capitalized, higher growth, smaller companies at home.

By extension then, if markets were concerned about the "fiscal cliff", one should see a benchmark such as the Russell 2000 small-cap index underperform (be down more/up less on average) the S&P 500 large-cap index.

The way to do this is through a price ratio.

Gayed: How to Track Market Sentiment on the ‘Fiscal Cliff’
Source: stockcharts.com

Take a look at the price ratio of the iShares Russell 2000 ETF relative to the S&P 500 ETF.

I have highlighted the most recent behavior of the small vs. large ratio to show that there is a legitimate tug of war underway.

The trend has not broken down meaningfully, which suggests that money is optimistic that a worse-case scenario will be avoided, but at the same time the ratio has not risen either because there clearly is not an actual resolution in place yet.

However, for those interested in tracking the pulse of the market's concern over the "fiscal cliff", this particular price ratio and the spread differential is a real-time way of gauging just what money thinks will happen.
(Read More: 'Fiscal Cliff' Mess Is a 'Grand Canyon' - Gross)

Michael A. Gayed, CFA, is chief investment strategist and co-portfolio manager at Pension Partners, LLC., an investment advisor which manages a mutual fund and separate accounts.

This writing is for informational purposes only and does not constitute an offer to sell, a solicitation to buy, or a recommendation regarding any securities transaction, or as an offer to provide advisory or other services by Pension Partners, LLC in any jurisdiction in which such offer, solicitation, purchase or sale would be unlawful under the securities laws of such jurisdiction. The information contained in this writing should not be construed as financial or investment advice on any subject matter. Pension Partners, LLC expressly disclaims all liability in respect to actions taken based on any or all of the information on this writing.