Are Stocks Headed for Capitulation?

Dow Transports: Buying Opportunity?
Getty Images

Technical indicators are showing that stocks are oversold short-term, but the market still continues to fall.

On Thursday, the S&P 500 index closed down 7.31 percent from its recent high in September and is 87.28 points away from testing its low for the year of 1266.04 in June.

While oversold conditions don't mean the indexes can't go lower, we looked at broader market sentiment to see if there will be any temporary relief for the markets from recent downslide.

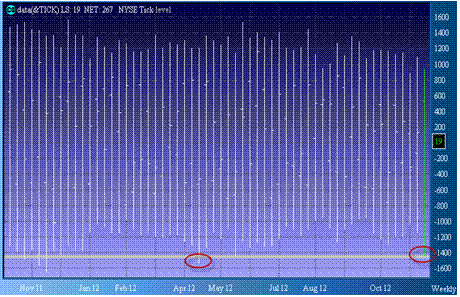
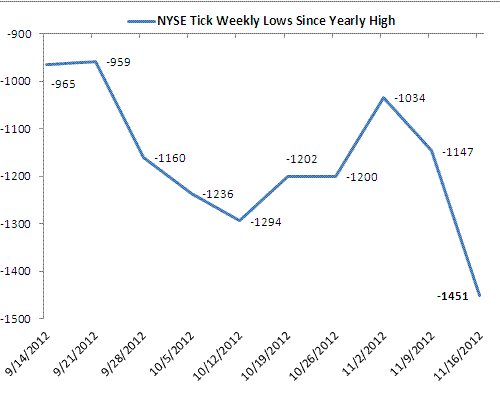
One of barometers that measures the market breadth is NYSE Cumulative Tick, which recently registered the weekly low of negative 1451, the level not seen since the week ending April 13, 2012. Prior to that, NYSE tick hovered around negative 1400 level in November 2011, after which the S&P 500 index had a run-up of approximately 15 percent.

The index is derived by subtracting net upticks from net downticks at any given time for NYSE traded issues, and is used by traders to enter or exit out of position on intraday basis.

Further, when viewed at larger time intervals, the TICK can also be used as a contrarian indicator to gauge market extremes when uptick stocks significantly outnumber downtick stocks and vice-versa.

Thus, in a short-term downward trending market like the one we have been seeing recently: extreme levels of NYSE ticks as indicated by levels of negative 1,400 or higher generally signal accelerated selling and short-term capitulation— the condition that can give rise to temporary halt in downward momentum and move off the lows.