


(Click for video linked to a searchable transcript of this Mad Money segment)
With the S&P 500 making another all-time high on Tuesday, Jim Cramer thought it valuable to consult with Mark Sebastian, the director of trading and investments at Swan Wealth Advisors, to see what trendlines suggest about the current market and just how much life may be left in the old bull.
Although Cramer is first and foremost a fundamental investor, he was particularly interested in Sebastian's technical analysis because, in the past, Sebastian's market timing had been remarkably accurate.
"You may remember, a couple of years ago, back in April of 2012, Sebastian looked at the behavior of the VIX," the "Mad Money" host said, referring to the index that tracks volatility in the market and typically trades inversely to the S&P 500. "Two years ago, he predicted that stocks would have a magnificent long-term bull run. And man, he totally nailed it."
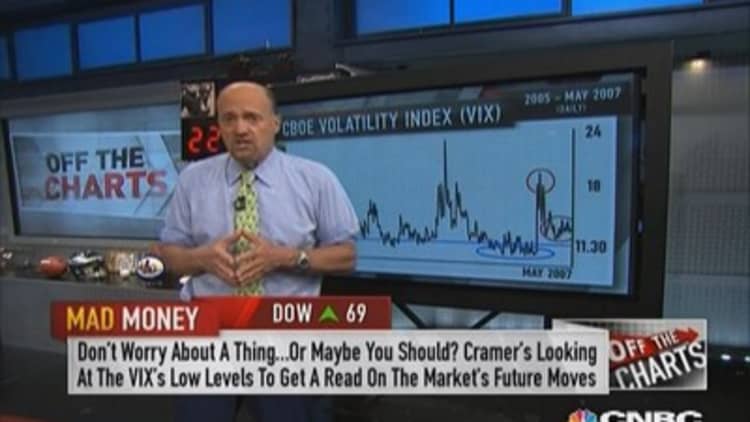
Looking at current patterns in charts that track volatility, Sebastian sees almost the opposite. Now he thinks there may be cause for concern. Specifically, he believes a pattern is emerging that was last seen in 2007, right before stocks turned sharply lower.
Largely, Sebastian notes that from 2002 until 2007, as the S&P advanced, the VIX would spike, but when the spike was over, the VIX would fall back. And when it fell back it would make lower and lower lows.
That's important: lower and lower lows.
Sebastian says the pattern held for years, and as long as it held, the rally in the S&P continued.
However, in 2007, after a big spike and subsequent pullback, the VIX failed to get anywhere near its previous lows. Instead it reestablished itself at a much higher level. When that happened, the bull was over.
Turning attention to the current market, Sebastian says the VIX is still making lower lows. Again, as long as the VIX makes lower lows, the S&P 500 should continue to advance.
However, looking at the RVX, a measure of volatility in the , Sebastian says it's generating that trouble pattern reminiscent of the VIX in 2007. Specifically, he says the RVX spiked in February, but rather than going back to its previous lows around 16, it only pulled back to about 18, establishing itself at a higher level. Sebastian views this as a red flag for the Russell 2000.
And if the Russell 2000 is facing trouble, then Sebastian thinks it's only a matter of time before the trouble spreads to the S&P 500.
In turn, he thinks patterns in the RVX could be an early sign that the bull run could be nearing its end broadly.
--------------------------------------------------------
Read more from Mad Money with Jim Cramer
Cramer's money making moves into month's end
Cramer's break-up play... say what?
Cramer's Amazon-proof retailers
--------------------------------------------------------
Cramer isn't so sure. "I'm not nearly as worried as Sebastian," Cramer said. "There are plenty of fundamental reasons for the advance to endure. However Sebastian's work has been prescient, therefore I think it warrants consideration. And quite frankly, nobody ever got hurt taking a profit."
Call Cramer: 1-800-743-CNBC
Questions for Cramer? madmoney@cnbc.com
Questions, comments, suggestions for the "Mad Money" website? madcap@cnbc.com