Are red or blue states better job creators?

CNBC analysis of state level job data shows slight GOP advantage

A company representative demonstrates sign spinning at the Choice Career Fair in San Antonio, Texas.
Matthew Busch | Bloomberg | Getty Images
A company representative demonstrates sign spinning at the Choice Career Fair in San Antonio, Texas.

It's still all about jobs.

As the race for the White House picks up speed, there is a long list of issues on voters' minds—from immigration to abortion to race to the rising pile of student debt. And as the economy climbs back from the depths of the Great Recession, both political parties are eager to take credit for the recovery in the job market.

In the first Republican presidential debate last week, current and former governors were quick to cite jobs gains as part of their record of success, including former governor Jeb Bush (Florida, 1.3 million jobs claimed) and current governors John Kasich (Ohio, 350,000 jobs), Chris Christie (New Jersey, 192,000 jobs) and Scott Walker (Wisconsin, who cited a drop in the jobless rate from "over 8 percent" to 4.6 percent.)

Former Texas Gov. Rick Perry claimed the biggest jobs gains, saying his state had created 1.5 million jobs "during the worst economic time this country's had since the Great Depression, while the rest of the country lost 400,000 jobs."

Democrats, on the other hand, can point to the ongoing economic recovery and take credit as the party in power during the recovery, a point underscored by President Barack Obama in his State of the Union speech in January.

"Since 2010, America has put more people back to work than Europe, Japan and all advanced economies combined," he said.

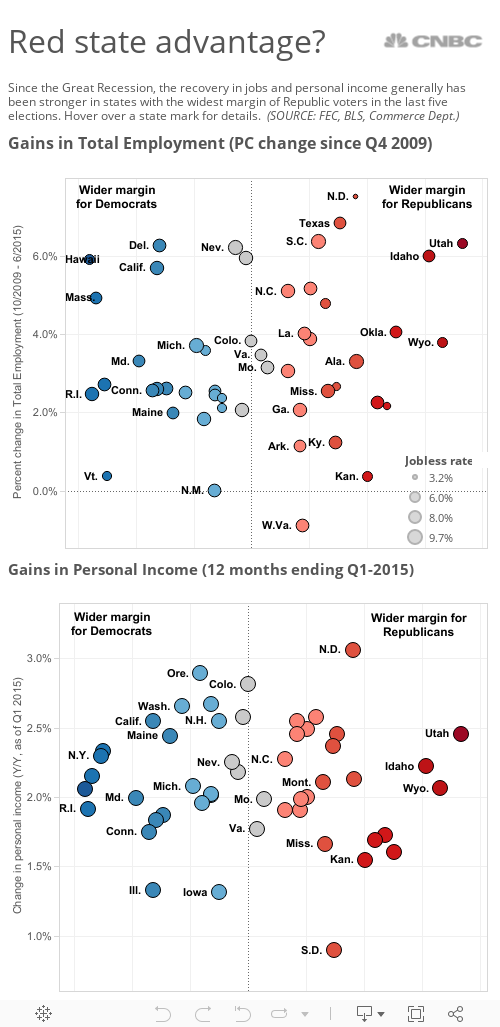
To find out how well each party can lay claim to job creation and worker well-being, cnbc.com analyzed state level economic data comparing the growth in overall employment since late 2009 to see how red and blue states have fared.

Read More America's Top States for Business 2015

Based on the numbers, Republican candidates have a somewhat better story to tell.

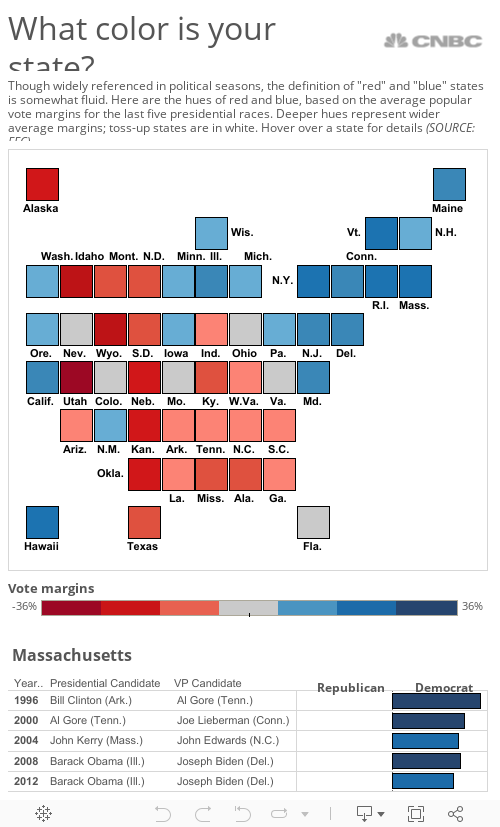
Though widely referenced by commentators and the media, the definition of red and blue states is somewhat fluid. There are a number of ways to identify a state's politics color, from Electoral College votes for presidential races to voter registration, congressional delegations or control of the statehouse and governors' mansions.

For this analysis, we chose the percent of the popular vote from each of the two major parties in each of the last five presidential elections, weighted by the average vote margin. (We ignored third party candidates.)

The result is that some states have a much deeper hue than others. A deep blue state like Hawaii, for example, which voted for the last five Democratic tickets with an average margin of victory of 28.1 percentage points, is more likely to vote for a Democrat in 2016 than a pale blue state like New Hampshire, where Democrats won four out of five times with an average margin of just 5.6 percent.

For Republicans, Utah is the reddest state, with five consecutive GOP wins and an average margin of 36.7 percent. (When the average margin was less than 6 percentage points, we colored the state white—because no color predominates—rather than purple, the color of choice among TV producers for toss-up states.)

Though relative party strength varies widely, Americans who turn out to vote for a new president remain very evenly split, based on state-by-state vote margins over the last five elections. The average state-level margin was just six-tenths of a percentage point, tipping very slightly for Democrats.

They are also fairly evenly divided on which party has the better record for managing economic growth and creating jobs. Though voters have given Republicans somewhat better marks in the past few years, Democrats were seen as better steward of the economy in the latest response to that question from pollsters at the Pew Research Center.

Since the depths of the Great Recession, the American economy has staged a comeback that has more than made up for the roughly 8.7 million net jobs lost from early 2008 through the start of 2010. From a peak of 10 percent in October 2009, the national unemployment rate has fallen almost in half, to 5.3 percent as of last month.

Read More US job openings total 5.2 million in June vs 5.3 million expected

But the job recovery at the state level has been much more uneven.

To see how states compare, we looked at the percentage gain in net new jobs from the fourth quarter of 2009 through June of this year, the latest state level data available. (Not all states' job market hit bottom at the same time, but we chose the fourth quarter of 2009 as the starting point for the job recovery because the overall level of U.S. employment began recovering in the first quarter of 2010.)

With the exception of West Virginia (a pale red state) and New Mexico (pale blue), all states have added jobs since that late 2009 trough.

But nine red states have posted net job gains for 4 percent or better since then, compared with only four blue states.

North Dakota (solidly red) leads the pack with 7.5 percent more jobs than in late 2009. Other big job gainers include Texas (6.8 percent), South Carolina (6.4 percent), Utah (6.3 percent), Idaho (6 percent), Indiana (5.2 percent), North Carolina (5.1 percent), Montana (4.8 percent), Louisiana (4 percent) and Oklahoma (4 percent).

Among blue states, biggest job gainers were Delaware (6.3 percent), Hawaii (5.9 percent), California (5.7 percent) and Massachusetts (4.9 percent.)

Jobs gains were also strong in Nevada (6.2 percent) and Florida (6 percent). But by our measure those states are political toss-ups, with a split track record and an average vote margin of less than 6 percent.

While red states seem to have a slight advantage in job creation claims, the correlation is not overwhelming. Among the states with the slowest job recoveries, four red states have produced sub-2 percent growth, including Arkansas (1.1 percent), Kentucky (1.2 percent), Kansas (0.4 percent) and West Virginia (-0.9 percent). Only three blue states fell below that level, including Oregon (1.8 percent), Vermont (0.4 percent) and New Mexico (unchanged).

Read MoreMilitary veterans fare well in recovering job market

Some skeptics argue that jobs gains alone aren't the best measure of voters' economic prospects—especially if the bulk of new employment consists of low-wage work. But workers in red states have seen relatively strong gains in personal income during the last 12 months.

North Dakota also leads the pack, with a 3.1 percent gain in personal income, among the 15 red states showing income gains of 2 percent or better. That's just slightly better than the 14 blue-hued states that posted comparable income gains.

Personal income also rose 2 percent or more in four toss-up states.

Voters in big job-gaining states may not necessarily agree that the job market is strong, especially in states where the jobless rate remains high despite the strong increase in payrolls.

As the biggest job gainer in percentage terms, North Dakota also enjoys the lowest state unemployment rate (3.2 percent). But in South Carolina, where job gains have topped 6 percent, the jobless rate was still a painful 9.1 percent in June. Among blue states, California has rapidly expanded its payrolls, but its unemployment rate was still 8.9 percent.

Among states showing slower job growth, solidly blue Vermont, home to Democratic president candidate Bernie Sanders, has only added four-tenths points to its payrolls, but its jobless rate is a below-average 4.6 percent. Red state Nebraska, which has expanded its job base by just 2.2 percent, had an June unemployment rate of just 3.7 percent.