Obviously, this comparison omits a week of trading initiated in panic and concluded in disbelief. Even evaluating market and sector results on a closing basis does not fully demonstrate the volatility of this action. Yet market movements during the past two weeks were fairly faithful to history. Typically after a sharp drop, the market undergoes an impressive pop. From the close on August 17, when the S&P 500 last traded above the 2,100 level, until August 25, the bottom of the correction (thus far), the S&P 500 fell 11.2 percent. All 10 of its sectors slipped in price, with seven tumbling by double digits.
Indeed, while the worst performers – energy, financials and technology – fell by 12 percent or more, Consumer staples, telecom services and utilities retreated "only" 8 percent to 9 percent. As has usually been the case, the three worst performers during the sell-off were among the strongest advancers during the recovery. Is the worst behind us? Possibly not. On Tuesday, we start a month with a bad reputation.
Read MoreThe only thing that can save this market
September is the only month in which the S&P 500 fell more frequently than it rose. What's more, in the 11 times that the S&P 500 fell by more than 5 percent in August, it declined in 80 percent of the subsequent Septembers, and fell an average of nearly 4 percent. And why might this month be true to history? End-of-quarter mutual fund window dressing, a projected 4 percent decline in third quarter S&P 500 operating earnings per share, and the renewed possibility that the Federal Reserve may begin its rate tightening cycle at its upcoming mid-September Federal Open Market Committee meeting.
With so many stocks having endured sharp declines since the May 21 peak, many mutual funds will likely be unloading underperformers that, if included in the end-of quarter list of holdings, might result in shareholder complaints. Better to "mark 'em down, and move 'em out." September is also the final month of the third-quarter earnings period. With concerns continuing to swell over the slowdown of China's economy, third quarter S&P 500 earnings per share performance may weaken even further from the current estimate of a 4.0 percent decline from the same quarter last year, according to Capital IQ's aggregate earnings estimates. Add to these items of concern, recent FOMC member commentary indicating that the Fed will not be deterred from beginning to recalibrate interest-rate policy by recent stock market volatility, and U.S. stocks may have further to slip before finding a floor.
Read More Jack Bogle: Best moves now to ride volatility
This peak-to-trough decline of 12.4 percent from May 21, 2015 through August 25 was fairly mild compared with the other 19 corrections since World War II. Indeed, this drop ranks only #14 of 20. What's more, history says we may have further to fall. The median decline after going more than 30 months since the prior decline in excess of 10 percent (this advance went 44 months), was 19.9 percent, or roughly the cusp of a severe correction/shallow bear market, whereas a decline to technical support around 1,820 would result in a near-normal correction of less than 15 percent. In the end, however, no one knows for sure how deeply the market will eventually fall.
So there you have it. The S&P 500 bounced off of a 12.4 percent decline last week and now trades 6.7 percent below its May 21 all-time high. Month to date through the 28th, the 500 had dropped 5.5 percent.
Read MoreChina stocks are still scary at this level
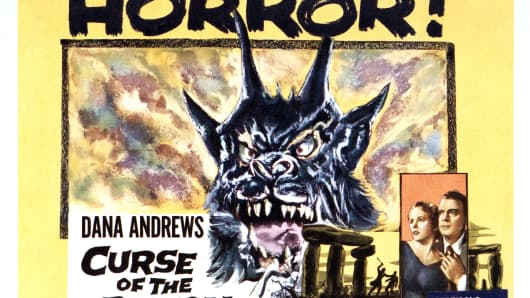
History says that the worst may not be over, as Septembers typically show an additional decline of about 4 percent after the market was down more than 5 percent in August. Plus, the time between corrections implies that the S&P 500 needs to decline even further to reset the dials after such a lengthy advance between 10 percent+ declines. Add to these the likelihood of mutual fund end-of quarter window dressing, a projected 4-percent decline in third quarter S&P 500 operating earnings per share, and the resurrected possibility that the Fed may begin its rate-tightening cycle at its upcoming mid-September FOMC meeting, and an even better B-grade horror movie title may emerge.
Commentary by Sam Stovall, U.S. equity strategist, S&P Capital IQ and and author of The Seven Rules of Wall Street. Follow him on Twitter @StovallSPCAPIQ


