

Bonnie Jo Mount | The Washington Post | Getty Images
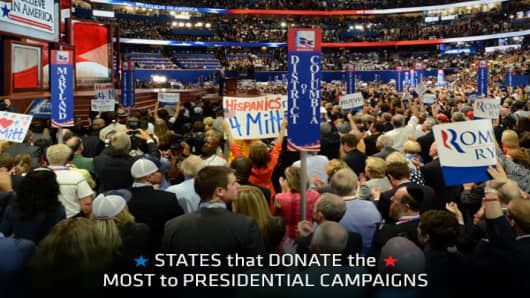
The states that donate the most money to presidential campaigns are among the largest and most populous in the country. Places like California, Texas and New York have enormous populations that make generous lump sum political donations.Yet when the data is mined to determine which states are the largest donors on a per-household basis, however, the picture changes significantly. On that score, states with small populations and scant Electoral College votes are among the largest donors when the
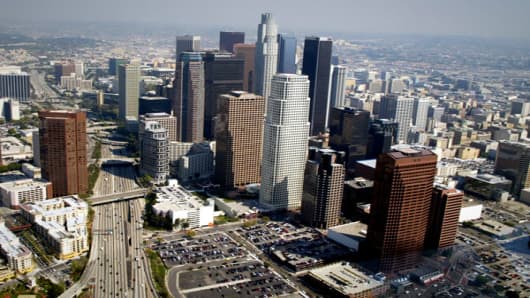
Photo: Frazer Harrison | Getty Images
Contribution per household: $5.37 Total political contributions statewide: $66,663,120 Total number of households statewide: 12,406,475 The most populous state in the nation, California, ranks only 10th in political contributions per household. In a state that has been claimed by Democrats since 1992, Californians donated more to the campaign of President Barack Obama than all other Republican candidates combined. According to the FEC numbers, Obama pulled in donations in excess of $39.2 million
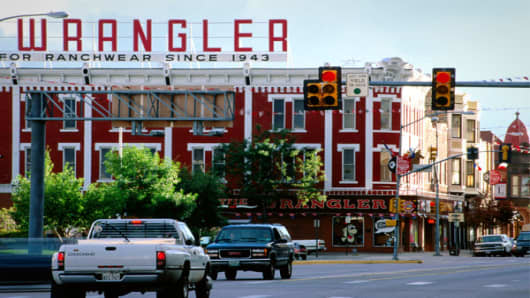
Photo: Holger Leue | Getty Images
Contribution per household: $5.43 Total political contributions statewide: $1,209,836 Total number of households statewide: 222,803 Although Wyoming only commands 3 electoral votes, the state is doing more to affect the election than many bigger states on a household-by-household donation basis. The state has voted Republican every year since 1968, with 65 percent of ballots going to McCain in 2008. As far as donations go, those that so far have voted with their wallets in the form of political
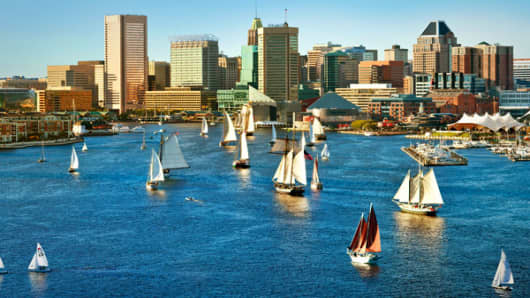
Photo: Greg Pease | Getty Images
Contribution per household: $5.58 Total political contributions statewide: $11,876,308 Total number of households statewide: 2,127,439 Maryland has continued to be a Democratic strong hold over the past several decades and was last won by Republicans in 1988 when President George H. W. Bush won the election. With a close proximity to the nation’s capital, the Presidential donations coming from Maryland have been concentrated in the central area of the state, closest to Washington D.C. This year,

Photo: Adam Kazmierski | Getty Images
Contribution per household: 5.59 Total political contributions statewide: $40,216,413 Total number of households statewide: 7,196,427 Although Democratic presidential candidates have carried New York State in the last several election cycles, the state has elected many Republicans to statewide office and New York City, known the world over a bastion of liberalism, has been helmed by Republican mayors since 1994. The state donated $40,216,413 to presidential campaigns in 2012, with Democrats rece
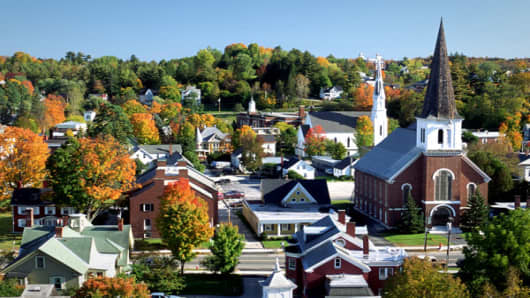
Photo: David Frazier | Getty Images
Contribution per household: $5.91 Total political contributions statewide: $1,518,693 Total number of households statewide: 256,922 Vermont's progressive politics are very similar to those shared by its fellow New England states. The state is so progressive, in fact, that its junior senator, Bernie Sanders, happily describes himself as a socialist It should come as no surprise then that the state's donations to presidential campaigns go lopsidedly to the Democrats, who received $1,280,805 of the
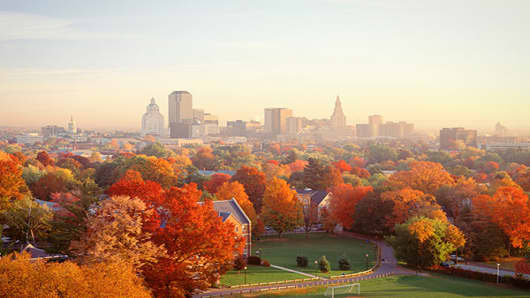
Photo: Panoramic Images | Getty Images
Contribution per household: $7.00 Total political contributions statewide: $9,521,770 Total number of households statewide: 1,358,809 Connecticut is a state with deep ties to the financial sector, due to its proximity to Wall Street, its wealth of insurance companies and its hedge funds. Although it is a traditionally blue state, donations to Republican candidates were much greater than those given to the Democrats. Republican candidates received a total of $6,056,800 from the state, while the D
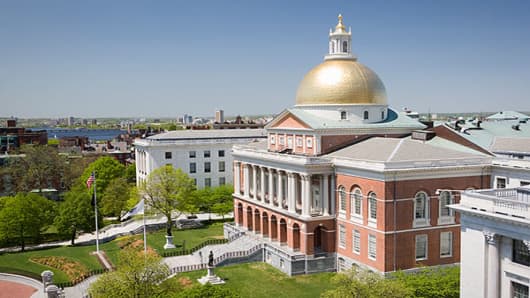
Photo: Travelpix Ltd | The Image Bank | Getty Images
Contribution per household: $7.09 Total political contributions statewide: $17,878,370 Total number of households statewide: 2,520,419 A traditionally liberal state, Massachusetts has been a Democratic Party stronghold for years, despite electing the occasional Republican senator or governor. Of the $17,878,370 in presidential contributions made in the state in 2012, $11,111,345 went to the Democrats and $6,744,857 went to Republican candidates, in particular its former governor, Mitt Romney.
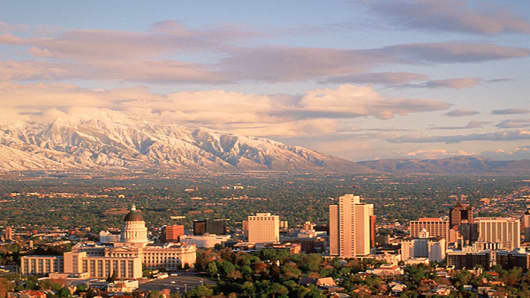
Photo: William Floyd Holdman, Jr. | Photolibrary | Getty Images
Contribution per household: $7.25 Total political contributions statewide: $6,379,445 Total number of households statewide: 880,025 Desert-bound Utah has a relatively low number of households but still made it to the third slot in terms of political contributions, with the majority of donations going to Republican candidates. According to the FEC data, President Obama received $868,565, whereas Republicans hauled in approximately $5.5 million, with Romney received $4.8 million from donors.
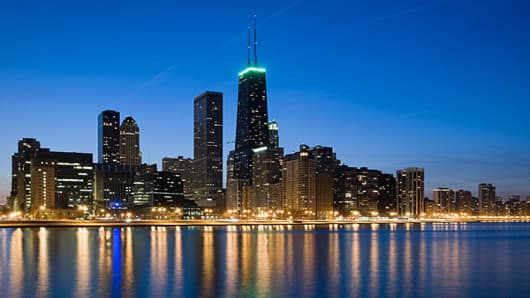
Photo: Chris Pritchard | Photodisc | Getty Images
Contribution per household: $8.46 Total political contributions statewide: $40,198,120 Total number of households statewide: 4,752,857 In Illinois, Chicago, the third-largest city in America, plays a key role in ratcheting up the number of households in this populous state. The breakdown of donations to presidential campaigns in this Midwestern capital skew heavily Democratic, with approximately $32.1 million going to the Obama campaign and approximately $8 million to Republicans. Of the Republi
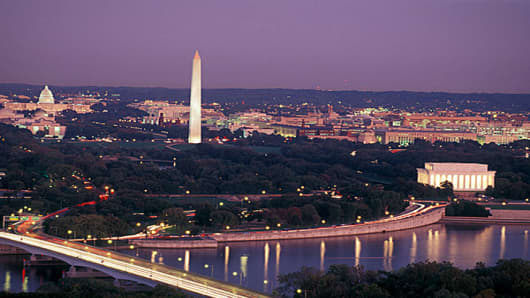
Photo: Jeff Greenberg | Peter Arnold | Getty Images
Contribution per household: $32.18 Total political contributions statewide: $8,122,739 Total number of households statewide: 252,388 The district that’s home to the nation’s capital has a minimal population which is maximally involved in politics, so it’s no surprise that it tops off this list. The most allocations by far went to Obama, with a breakdown of about $6.4 million to him and about $1.7 million to Republicans candidates. Of the Republicans, $1.406 million went to Romney, and $93,773 to
