The bond market sent a scary signal to the stock market Tuesday about the economy, but it's probably not time to freak out — yet.
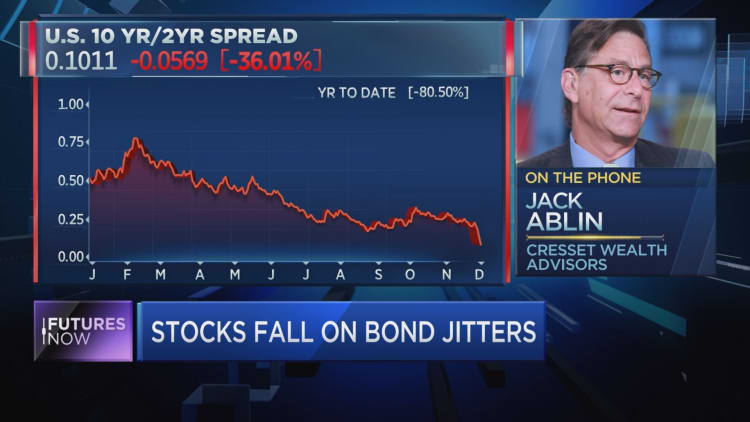
Yields of some shorter-dated Treasurys passed those of longer-duration issues, a condition known as an inverted yield curve.
While inversions have been reliable recession indicators in the past, the most important relationship — between the 3-month and 10-year government notes — is not inverted and thus hasn't triggered the likelihood of a contraction ahead.
The seminal study on inverted curves came from the New York Federal Reserve in June 1996.
Economists Frederic Mishkin, who a decade later would serve on the central bank's Board of Governors, and Arturo Estrella said comparing yields "can have a useful role in macroeconomic prediction, particularly with longer lead times." The yield curve, they found, "strongly outperforms other variables at longer horizons" which "makes its use as a forecasting tool even more compelling."
In the more immediate case, the market is concerned that the 2-year note yielded higher than its 5-year counterpart during Tuesday trading. The general interpretation is that an inverted curve means investors are worried about longer-term growth and expect yields to be lower further out on the curve. Inverted curves have been reliable recession indicators for the past 50 years.
The difference between the 10-year and the 3-month notes, though, still remains significant.
That gap was around 49 basis points, or less than half a percentage point — definitely not an inversion, but at its lowest point in more than 11 years.
Gauging the spread between the 10-year and 3-month notes
"An inverted yield curve is often associated with the anticipation of a recession which may be why investors are nervous about it but I'm not convinced this is what's going on," Craig Erlam, senior market analyst at forex brokerage OANDA, said in a note.
"The Fed has been tightening policy at a decent rate and if the economy starts to slow then it makes sense that it may cut rates a little to provide some support. This would imply lower levels of growth which naturally is a drag on stocks and may therefore explain some of the selling today," Erlam added.
Indeed, the Fed is at the center of the rate fears. The central bank has been steadily hiking its short-term rate while longer-term rates have progressed less rapidly.
Fed officials largely have said they are watching the yield curve but view it as only one indicator among several they are monitoring regarding economic health. They, too, generally agree that the most relevant relationship is the 3-month/10-year comparison.
This time is different, maybe
The Cleveland Fed's recession indicator, which measures the chances of an economic decline over the next 12 months, is currently at just 20.3 percent. However, as the curve has flattened the indicator has ticked higher, rising from 16.6 percent in October.
"While the inversion between the 2-year and 5-year point of the Treasury curve is notable, the spread between 3-month Treasury bills and the 10-year US Treasury is still 50 basis points and it could be many months before we see that point of the curve invert," said Charles Ripley, senior investment strategist at Allianz Investment Management.
Even then, there's no certainty of a recession.
Fed officials and some Wall Street strategists see a legitimate "this time is different" case for the yield curve. It's based on a concept called term premium, or the reward investors demand over time for the risk they take. The argument is that investors are willing to buy long-term U.S. bonds because their yields, while low historically, are still much higher than most other countries' bonds of similar duration.
It's all come during a time when central banks have intervened in markets like never before, creating distortions that might not make an inverted curve as relevant.
"Term premium is very depressed due to low yields abroad," Barry Bannister, head of institutional equity strategist at Stifel Nicolaus, said during a presentation Tuesday in New York. "There is a repressive effect on the long end. If there's an inversion, it's less negative than it was in the past."
That's not to say investors should take the relationship too casually. Degree of the inversion could be the key.
Asked if an inverted curve is portending bad things ahead, Bannister said, "if it gets out of hand it is."