


NASA is best known for sending astronauts to space, but the organization does a lot of work tracking weather and disasters on Earth too. To help people predict and respond to natural and technological disasters, NASA's Earth Science Disasters Program uses satellites to observe Earth from space.
The program studies earthquakes, fires, floods, industrial accidents, landslides, oil spills, severe weather, tropical cyclones, volcanoes and winter weather.
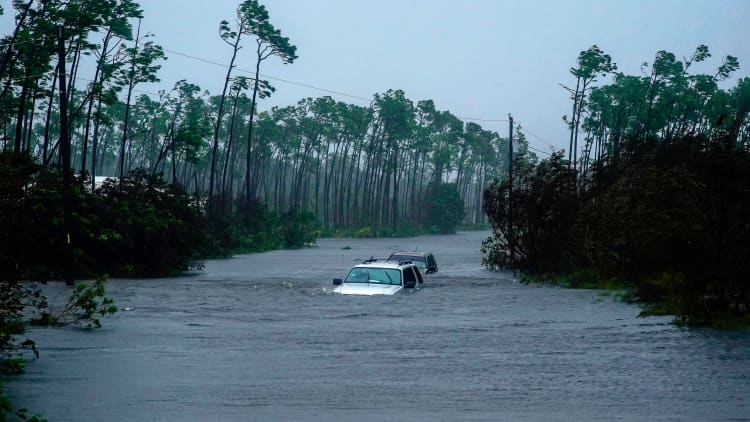
The moving animation embedded below is one example of NASA's using data to track extreme events. This moving image is a representation of Hurricane Dorian, the storm which leveled the Bahamas, leaving at least 30 dead, and is currently wreaking havoc on the southern portion of the Eastern seaboard.
The color-coded animation charts shows four slices of Hurricane Dorian at 2 a.m. EDT on Sep. 3, 2019, at four different depths of the storm. Pink, red and yellow mark the areas of the heaviest rain. Green represents the least intense rainfall.
Credits: NASA/JPL-Caltech/NRL-MRY
The animation is generated with data from an "experimental" satellite used to track weather patterns, NASA says in a statement published Wednesday. The satellite — the CubeSat TEMPEST-D (Temporal Experiment for Storms and Tropical Systems Demonstration) — is "the size of a cereal box," NASA says.
The photo below shows the TEMPEST-D with the three solar panels unfolded. Each of the three black solar panels are 34 cm x 20 cm (13.5" x 8"), Steve Reising, the Principal Investigator of TEMPEST-D and a professor at Colorado State University, tells CNBC Make It.
"They unfolded from the satellite shortly after it was deployed from the [International Space Station]," Reising says. "The main satellite is the silver-colored box on the right, which is 13.5" x 8" x 4" (34 cm x 20 cm x 10 cm), not very different in size from a cereal box."
The satellite uses a microwave radiometer to measure rain and moisture in the clouds, NASA says.
The TEMPEST-D is both smaller and less expensive than its predecessors.
"This is new passive microwave sensor technology that has been miniaturized to fit a very small CubeSat. It is designed to produce the same quality data as our operational weather satellites, but at a small fraction of the cost," Shannon Brown, the project manager of the TEMPEST-D mission and a member of NASA's Airborne Science Program, tells CNBC Make It. The CubeSat TEMPEST-D launched in 2018.
"The Dorian observations highlight its capability to measure the precipitation and overall structure of the storm in three dimensions," Brown tells CNBC Make It, and aim to prove its capabilities to scientists and meteorologists.
TWEET: experimental weather CubeSat, TEMPEST-D
A future goal of these small satellites is to use them in small groups to get higher quality weather prediction information and at the same cost as current weather satellites, Brown tells CNBC Make It. "This will be transformative for weather forecasting and monitoring these storms when they are out in the ocean, away from our land based radars," he says.
The data for the animation showing the moving layers of Hurricane Dorian were taken on Tuesday, as the storm approached Florida. On Friday, Hurricane Dorian made landfall on the Outer Banks of North Carolina.
TWEET: #Dorian has made landfall over Cape Hatteras, North Carolina at 835 AM EDT.
The extent of damage in the Bahamas is still being assessed. The image, embedded below, shows the Bahamas on Monday after Hurricane Dorian had drowned the region in rain and wrecked it with winds.
The square box on the right is a magnification of the smaller white box on the left. The light blue color in the map is what was "likely flooded" at the time the image was collected, NASA said in a statement published Tuesday.
The map, which shows flooding in and around Marsh Harbour in the Abaco Islands in the Bahamas, was generated with data from the Advanced Rapid Imaging and Analysis (ARIA) team at NASA's Jet Propulsion Laboratory with the Earth Observatory of Singapore and the European Union's Copernicus Sentinel-1 satellites.
Broadly, satellite images NASA provides of disasters are used to better equip those responding.
"NASA works to leverage the power of our views of Earth from space and research aircraft to assist communities around the world as they plan for — and recover from — a wide range of disasters, from earthquakes to wildfires and severe weather events like hurricanes," the agency says. "NASA's Disasters Program, part of the Earth Science Division in the Science Mission Directorate, draws together expertise from across the agency when disaster strikes to provide information products for emergency responders."
TWEET: Hazards from Hurricane #Dorian reach far from its center.
See also:
Bill Gates: This is a 'great' way to use your tech skills
Jeff Bezos: I spend my billions on space because we're destroying Earth
Like this story? Subscribe to CNBC Make It on YouTube!