


The market's breadth and margin levels paint troubling signs for stocks, says Oppenheimer Chief Market Technician Carter Worth. On CNBC's "Options Action," the respected technician presented three charts that, by his work, predict a serious market correction.
First chart: S&P 500 vs. stocks above 150-day moving average
Worth's first cause of concern is market breadth, which gauges how widespread (or "broad") a market move is.
"Breadth is the most important thing in the market, just as it is in any other endeavor," Worth said in Friday's appearance.
That's why Worth is so concerned about the current trend in market breadth, as measured by the percentage of stocks above their 150-day moving average.
"Breadth is deteriorating, and it's been deteriorating for months," Worth said. "We know that the stock market made a high in May, made a new high in August, and made a new high in September. And yet as that's happened, the number of stocks that are above their respective 150-day moving average peaked at 90 percent, and it has been declining every month since. We hit a low of 59/60, and we think this is going quite a bit lower."
For Worth, "This is a divergence that is not good. And it speaks to fewer and fewer stocks participating."
Second chart: S&P 500 since the beginning
Worth then pointed to an all-time chart of the , on which the market's two prior highs are clear.
"Everybody knows we have the 2000, the 2007 high, and where we are now," Worth said. "Now a lot of what drives this thing, of course, is the participation rate on the part of the retail investor."
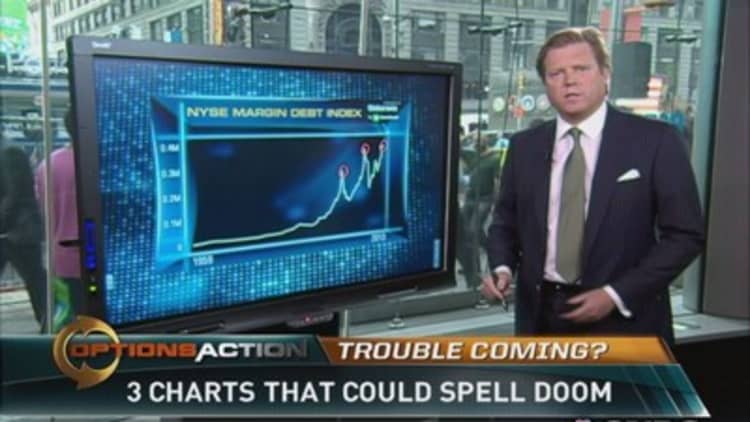
Third chart: NYSE margin debt index
Given the importance of investor participation, Worth then looked at NYSE margin debt.
As Worth explains, the chart looks at "all NYSE-member firms—my firm, Merrill Lynch, everyone. And the debt balance in margin accounts. Meaning people borrowing, excessively, to buy equities."
The Oppenheimer technician notes that the chart troublingly echoes the long-term chart of the S&P 500. "It peaked in 2000, it peaked in 2007, and now we are at record levels of borrowing on behalf of retail investors to buy stocks."
The implication is clear. "This is not a good circumstance," Worth said.
The big prediction
So what does it all mean for the market?
Worth told CNBC.com that his target on the S&P is 1,520. That means he sees the market falling nearly 10 percent from current levels.
—By CNBC's Alex Rosenberg. Follow him on Twitter: @CNBCAlex.
Follow the show on Twitter: @CNBCOptions.


