


Oil and stocks are moving almost identically with each other in the last few weeks. In fact, the correlations between the two are at nearly 100 percent, so it can't really get any higher than that, indicating a big turn could be on the way.
Specifically, according to data from Thomson Reuters, the 20-day rolling correlation between oil and the S&P 500 is at 0.96. The 50-day rolling correlation is at 0.90. A value of 1 would indicate that the two assets move in lockstep; -1 would indicate they move in completely opposite directions. Look at this chart of the correlation in the past year:

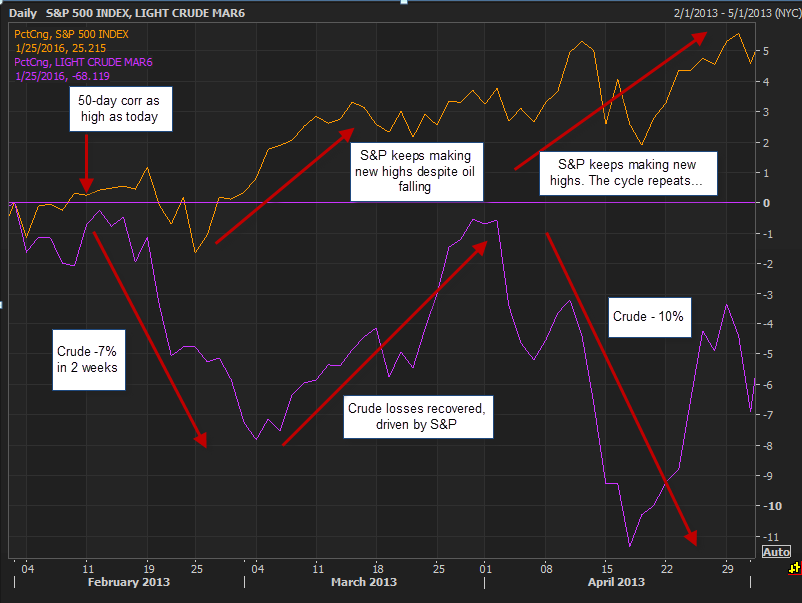
In the past 30 years, there have been levels sustained like this one time — in May 2012. In that case, stocks dropped about 10 percent in a month, while oil dropped from about $100 to $80 in the same time. The correlation broke when equities started to go back up as crude continued to slide.
That was typical of the other high-correlation examples we examined. Both assets fell until the stock market turned around. Here's a detailed example of how that worked in February 2013.
Similarly, last week CNBC.com reported that the stock market tends to rise after 2:30 p.m. ET — the moment that oil closes trading in the pits for the day. Equities have been in a tick-by-tick decline, but only in the hours that crude actually trades on the exchange. That 2:30-3:30 p.m. pop suggests equities want to rise up, if it wasn't for the psychological impact of oil bringing the entire market down.
In a Citigroup research note Monday, Tobias Levkovich suggested that it's not about oil and stocks, but rather a strong dollar affecting them both at the same time.
It creates a weird dynamic where airlines and other oil-sensitive stocks go down when you might think they should go up. One theme among market watchers is this isn't weird at all, but the sign of a lack of demand across the broader economy.
Some traders suggested that high correlation moves happen all the time, in different waves. Eventually they break when everybody else notices them. Past examples include the stock market moving tightly with the euro, or the dollar, until the correlations broke down.
Oil and stocks will have to go their own separate ways, and soon, because these high correlations don't last long. The irony would be if this time it's different, and oil rises while the stock market continues to decline. For the most part, however, the trends suggest a correlation breakdown has to come soon, which would indicate a move back up for the stock market.


