


An in-depth analysis by CNBC of the government's reports on gross domestic product suggests large and persistent errors that should give investors, business executives and policymakers pause in relying on the data for key decisions.
CNBC looked at each quarterly report going back to 1990 and found an average error rate of 1.3 percentage points. So an initial report of 2 percent growth on average later would be revised to 3.3 percent or 0.7 percent.
The research does not show any systematic overstatement or understatement of growth, just persistently large revisions.
CNBC also found:
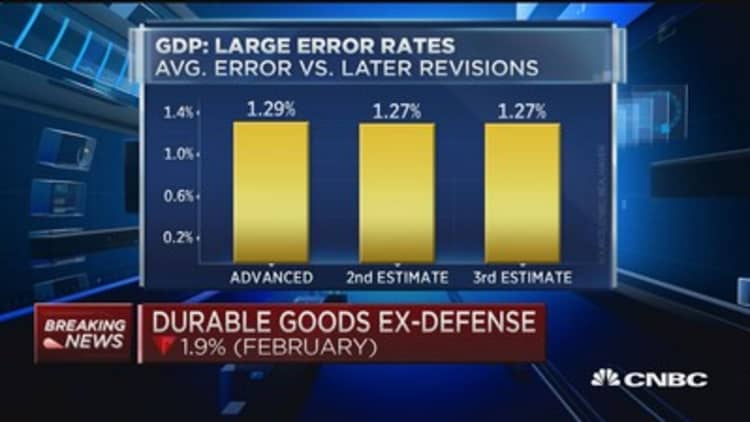
- The error rates in the second and third estimates of GDP are the same as the first. So despite more time and data, the error rates will be just as large three months after the end of the quarter as they are one month afterward.
- About 30 percent of the time, the government gets the direction of growth wrong. That is, GDP initially shown to be higher than the previous quarter could in fact be lower, and vice versa.
- The error rates haven't improved over the decades despite vast improvements in computing power and communications speeds. The size of the revisions from 2008 to 2013 is the same as those from 1990 to 1995.
The errors have potentially important policy implications. On April 30, 2008, with the Great Recession just gathering steam, the Federal Reserve cut interest rates by one-quarter point to 2 percent. That same day, the Bureau of Economic Analysis, the agency that produces the GDP report, announced that the economy was growing an anemic 0.6 percent but still growing.
If the errors are really what you say, then we really have no idea what's going on.Joel Naroffpresident, Naroff Economic Advisors
But in subsequent years, that GDP growth would be revised to show a contraction of 2.7 percent, the biggest decline in 17 years. While the Fed was acting aggressively in bringing down rates, the question is whether it might have done more had it known the severity of the decline earlier. (By the end of the year, an initial report of a contraction of 3.4 percent would be revised to show a massive decline of 8.2 percent.)
It can go the other way and have political ramifications.
In the second quarter of 1992, as President George H.W. Bush was running for re-election, growth was reported at a pedestrian 1.4 percent. It would be revised up in subsequent years, after the election of Bill Clinton, to a strong 4.5 percent.
"If the errors are really what you say, then we really have no idea what's going on,'' said Joel Naroff of Naroff Economic Advisors, one of about a dozen economists surprised to learn of CNBC's findings.
The findings raise warning signs for investors, policymakers and business executives about reacting too strongly to the initial government reports on economic growth.
Those warnings are especially important now that the trend growth rate has slowed to just around 2 percent. They raise questions about whether signals from the stock and bond markets provide better clues to the direction of the economy and whether the government could improve its reporting by incorporating the growing mass of private sector data.
They also make some wonder if government data agencies should be better funded.
"If you're betting your business on it, it's terrible because you're being told growth is strong or weak, and you're planning off it," Naroff said.
The majority of economists contacted did not know the error rate and most guessed an amount half of that calculated by CNBC. Some were off by two-thirds.
The government publishes three initial versions of GDP: the "advanced" report, about a month after the end of the quarter, the second estimate, published two months after the end of the quarter, and the third estimate, published about three months after a quarter's end. CNBC's research shows the error rate of all three releases is about the same 1.3 percentage points.
"That is something I've been concerned about, too," said Brent Moulton, associate director for national economic accounts at the Bureau of Economic Analysis.
"We're working to try to get more accurate data in time to improve the advance GDP estimate,'' including faster data on wages from the Bureau of Labor Statistics, he said. "Revisions are not errors They represent improvements to the GDP estimate as more information becomes available."
Moulton's agency publishes an average error rate for only the advanced report, compared with where the number will be revised to years later. That error rate, which appears as an end note to each "advanced" report, is virtually the same one as the one calculated by CNBC.
The agency, however, does not routinely publish an error rate for the second and third releases relative to the revisions in later years. It did publish a report on the overall accuracy of the GDP and all its versions in 2014.
Mark Zandi, chief economist at Moody's Analytics who was among the economists contacted by CNBC, was surprised that the error rate did not improve from the advance to the third release. He figured, as did others, the third estimate would be better than the first.
Moulton said the large revisions result from new information that his agency receives over time. For example, it takes a year before the agency gets more complete wage data and another year before it receives data from the Internal Revenue Service; after five years, the bureau has data from the broad economic census, which it uses to go back and revise GDP.
The bureau changes its methodology from time to time, for example, altering how it adjusts different parts of the data for seasonality.
Moulton says the bureau has been working to speed up the data it receives. Trade data that once took 45 days is now received in 30 days. It's also working on a way to speed up collecting inventory data, which is often a big swing factor in revisions.
Moulton noted that revisions are often largest around turning points in the economy, like when it's entering or exiting recession, as it was in 1992 and in 2008. And some variables are outside its control.
For example, individuals and companies are always going to file tax data late, receive extensions and amend returns. Corporate returns are often complicated.
Outside economists do not envy the bureau's task of measuring production in the $18 trillion U.S. economy. Over time, as the economy has become more service-oriented, it's become harder to measure actual output, especially when the measures include complex ideas like intellectual property.


"It's a more complex and esoteric economy," Zandi said.
For example, the economy used to be far more reliant on manufacturing, and measuring the value of automobiles produced is far easier than measuring the value of the fast-growing health care and education service sectors of the economy.
But with trend growth only 2 percent, an error rate of 1.3 percentage points presents a danger for policy errors.
Officials contacted by CNBC said they tend to rely more heavily on the jobs data than the GDP data, especially when they contradict each other, as is now the case. Fed officials tend to use running quarterly averages rather than a single quarter to gauge the direction of the economy.
Indeed work by CNBC shows that a more accurate picture emerges when four quarters are averaged together.
A study by the Organization for Economic Cooperation and Development found the U.S. about middle of the pack compared with other advanced countries on its error rates. The 2014 study by the Bureau of Economic Analysis itself suggests that over long periods of time, like five to 10 years, the BEA fairly accurately portrays growth.
Interestingly, it has a pretty good handle on the biggest part of the economy, the consumer. The revisions to consumptions over time are relatively small, including revisions to services. The biggest error rates are in business investment including equipment and intellectual property.
One irony is that the government data collectors have to go back and continuously revise the impact of government spending on GDP, which is to say, the government is not fully accurate in counting the government.
Correction: This story was updated to correct the revised growth rate to 3.3 percent.