


Gold has already rallied 28 percent in 2016, but according to one trader the charts are pointing to a new wave of momentum for the commodity.
"We're in the next uptrend," noted CNBC "Fast Money" trader Brian Kelly during a "Behind the Trade" special. "This uptrend has bounced several times. That's very positive price action."
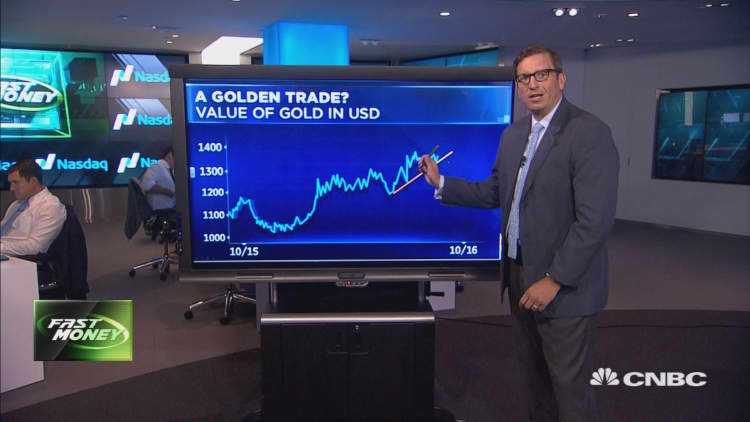
When examining gold's technical movement from October 2015, Kelly illustrated that the yellow metal established a large base above $1,000, which was followed by a breakout and then consolidation between $1,200 and $1,300.
From here, Kelly believes the excitement that has led to recent gains can be credited to two key factors: negative interest rates and the dollar.
"The U.S. dollar has been relatively weaker," Kelly said. "But, on the days that the dollar has risen gold, has also risen so they have become positively correlated. [Now], when the dollar is a safe haven, gold becomes a safe haven."
With this in mind, Kelly reasoned that the past negative correlation between the dollar and gold is starting to break down. Additionally, he added that the precious metal appeals to investors, because it offers better returns in a negative interest rate world.
"The old joke used to be that gold's a rock that you pay somebody else to store," said Kelly. "Well now cash is that rock."
He concluded by saying that if you have money in Switzerland, you're going to be charged heavily for that.
"So gold is a much better option," said Kelly. "If we get a breakout, certainly $1,400 is in the cards."