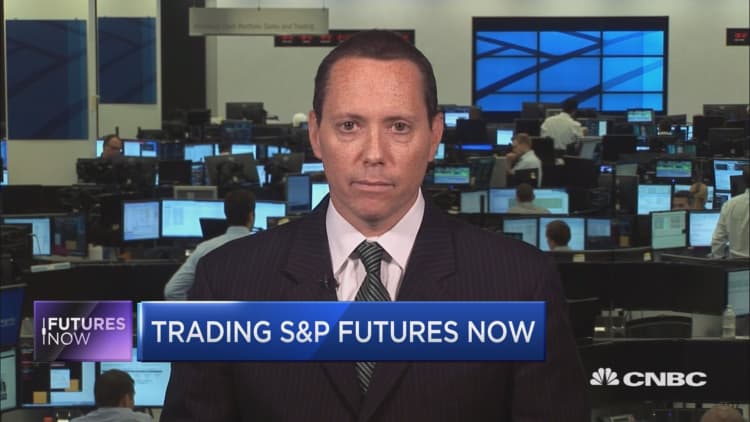


As equities continue to defy history and edge higher in August, a top Wall Street bank is keeping an eye on one key bearish indicator.
"We've had a couple of weekly candle patterns, which suggest that there's some indecision about the market," said Chief Equity Technical Strategist for Bank of America Merrill Lynch Stephen Suttmeier on CNBC's "Futures Now" on Thursday.
Suttmeier emphasized that while his team remains bullish on the S&P 500, traders should consider the candles in order to draw conclusions about the market's next move during the second half of August. Candlesticks show movement over a given period of time and the shape demonstrates highs and lows as well as opening and closing prices.
Suttmeier illustrated that in recent weeks, the technicals for the S&P 500 appear to be bearish and that the recent occurrence of two types of candles have been troubling. During the last week of July and during the second week of August, a "doji" occurred, which is when the open and close remain at comparable levels and ultimately represent a sign of indecision on Wall Street.
The other recent bearish candle was a "hanging man," which occurred during the first week of August. This type of candle is considered to be a risky pattern and shows an increase for the likelihood of an interim top. In conjunction, these candles could represent some near-term downside, but Suttmeier remains optimistic that a drop could set-up a base for gains in the long-term.
"We do think that the S&P could settle and find support somewhere around 2,147," noted Suttmeier. "However, the breakout should remain intact and we do see much further upside."
Year to date, the S&P 500 is up 7 percent and has gained 19 percent since the February lows. The index was relatively flat this past week and ended down less than 1 percent.
Ultimately, Suttmeier explained that, despite recent bearish signs in the market, the reasons for optimism remain strong.
"I think we've got a lot of things going for us: breadth, volume internals and the credit markets are firm," said Suttmeier while discussing why the S&P 500 has remained in a cyclical bull market since March 2009, the second longest stretch in history.


