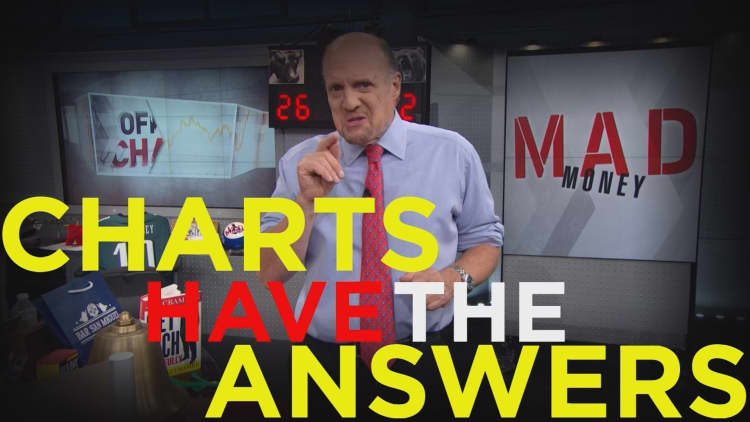
Jim Cramer isn't a chartist, but he understands why they are so important for predicting the next big stock moves.
"Why do charts work? First, you must consider them as if they are footprints at a scene of a crime. These footprints trace out what big money managers might be doing with their buying and selling of stocks," the "Mad Money" host said.
The second reason to care about charts, Cramer said, is that there is a remarkable self-fulfilling nature of charting stocks. Some of the best investment ideas can come from chart-inspired brainstorming sessions. However, Cramer has found that the best way to produce results is with a careful melding of both fundamentals and technicals.
A good technical analysis means being able to find the indicators that will help to determine the overall direction of the market, especially since so many stocks are influenced by stock futures.
He has also found that charts are especially helpful in determining the best entry and exit points on a stock.
"As long as sellers overwhelm buyers with their dumping, no base can form. A climax is a sign that those potential sellers who had been holding on for some time are finally giving up en masse," Cramer said.
Additionally when a chartist sees that the volume has grown or expanded but the stock doesn't go down, that means the stock has finally found its floor and is now safe to buy. That is when the number of buyers is finally equal to the sellers in their power to determine the direction of a stock.
Chartists also look at the advance of a stock, which happens when the stock takes out its resistance overhead. Technicians don't just look at the closing price and a graph against the previous day, because it won't actually paint a clear picture of the trajectory.
Instead, technicians use what is known as a moving average to better represent a stock's movement. They figure out the moving average by taking the closing price of a stock over a period of time, add them up, and then divide by the number of days in that measured period.
Investors can determine if a stock is overbought or oversold by charting the ratio of higher closes, also known as the relative strength index, or RSI. This is a momentum oscillator that measures the direction that a stock is going, and the velocity of the move.
Cramer also matches the RSI of an individual stock to something else, maybe the relative strength of its sector or a larger index, and then measure the price action historically. He looks for anomalies where strength stands out, because that is a sign that there is a pending move or a change in momentum.
The inverse can also be true; a stock can also fall so fast that investors should expect it to snap back because it is technically oversold. These patterns are reliable indicators that a change in direction is about to occur, and are terrific action points.
So, for investors that are debating whether to buy a stock, have done all the research and find that the stock is overbought, Cramer said to wait for the inevitable pullback that almost always happens.
The most simple and reliable chart pattern out there is one that Cramer dreads the most.
Unfortunately, Cramer learned not to ignore the head-and-shoulders pattern the hard way when his charitable trust bought Alcoa in the low teens in 2010, and ultimately took a loss because it was too early to buy.
"Yes, just like a human's head. That is the most frightening pattern in the chart book," Cramer said.
Likewise, if a head-and-shoulders pattern signals trouble ahead, then an inverse head-and-shoulders pattern signals the opposite — a chance for glory.
"The key with this pattern is the neckline, the line that connects the high to the two shoulders. When a stock breaks out above that line it tells a technician that you are about to witness a big move higher," Cramer said.
Another chart type that Cramer relies on is called the cup-and-handle pattern. In fact, he has used the reliance of this pattern to stay in stocks that he might have otherwise sold.
A cup and handle pattern is one that resembles a cup with a handle. The cup creates a 'U' shape with a downward drifting handle.
Cramer learned the lesson of the beautiful cup-and-handle opportunity in the stock of Domino's. He was thinking about selling the stock, when chartist Ed Ponsi set him straight and told him not to.
Ponsi pointed out that Domino's had reached a pivotal moment and was getting ready to launch into a bigger move. Sure enough, Ponsi nailed it—and Domino's proceeded to double and then some. It turned out that while Cramer was nervous about the stock, it was actually consolidating and getting ready to power higher.
"Technicians and fundamentalists can co-exist. Make peace with them both, and I bet you will make a heck of a lot more money than if you are blind to one or the other and certainly to both," Cramer said.


