


The bulls have history on their side, according to Oppenheimer technical analyst Ari Wald.
Just as the markets saw their share of ups and downs this week, future expected market volatility, as measured by the VIX, has gone through the same. The VIX hit its highest level in almost three months on Tuesday and the index has surged more than 30 percent since last Wednesday.
While that would generally be taken as a sign of rising investor anxiety, for Oppenheimer technician Ari Wald, "this volatility is marking an opportunity to buy stocks." Wald looks back to the history books to point out something that he sees repeating again.
"Since 1990, we've found that when the VIX spikes 50 percent and the S&P is in an uptrend, [for] the next six months, the S&P averages 8 percent gain versus an only 4 percent gain during any six-month period," he said Thursday on CNBC's "Futures Now."
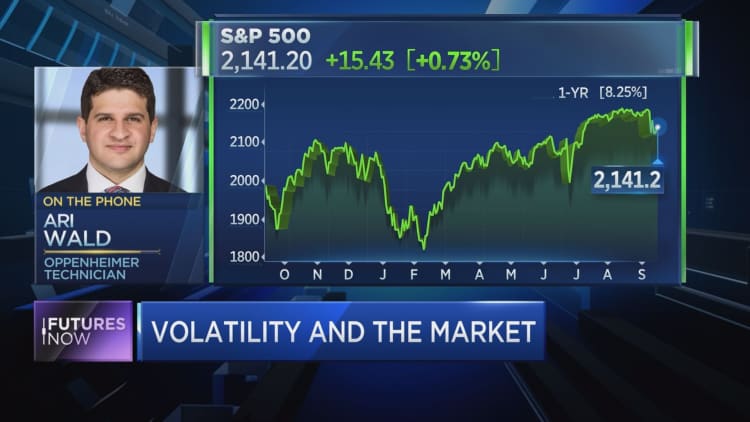
Wald's chart shows that such a trend actually happened this year. Volatility spiked near the end of 2015 while the S&P 500 was on the rise. Though stocks did fall in February of this year, the S&P ultimately rose more than 10 percent from January to the end of June.
On a long-term chart of the S&P 500 versus the VIX, Wald shows that the S&P 500 recently broke through resistance, a breakout that coincided with a spike in the VIX.
In other words, Wald believes that a short-term market rally is in the works, and investors may want to cash in.
Oppenheimer has a year-end target for the S&P 500 of 2,250, meaning that they believe the market could rise almost 5 percent.