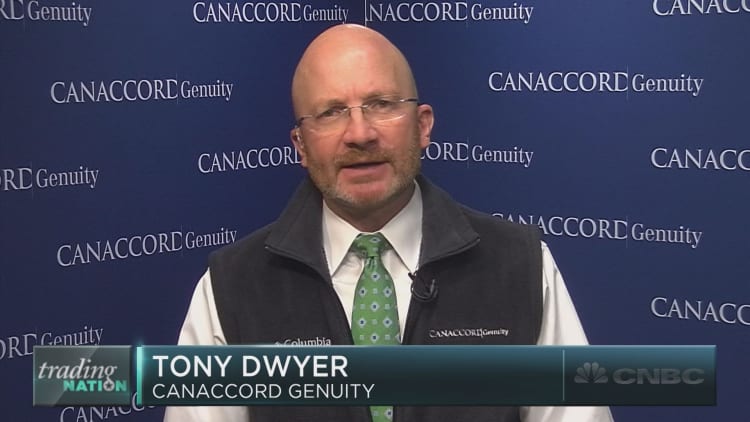


Rich Ross, head of technical analysis at Evercore ISI, sees another rally for stocks ahead based on one key indicator in the charts.
On Wednesday, markets rose slightly after the on Tuesday posted its worst one-day slip since October. And looking forward, Ross says stocks are likely to continue their post-election run.
Examining the chart of the SPDR S&P 500 ETF (SPY), Ross observes that the ETF remains above its 50-day moving average. That metric, which averages together the prior 50 closes, sat at $232.61 on Wednesday — less than a dollar below the SPY's intraday low.
"We test and hold this key level of support," Ross observed Wednesday on CNBC's "Trading Nation." "It has defined support throughout the entirety of the postelection move, and will continue to do so."
The fact that the key ETF has not broken below its 50-day moving average indicates to Ross that "the Trump trade is still intact."
Should SPY fall below its moving average, Ross believes the ETF could pull back to its mid-December high of $228, which is about 3 percent below Wednesday's closing price.
Through Wednesday trading, the S&P is just 2 percent below its record high, and is up about 5 percent year to date.


