


With oil prices on the rise, Jim Cramer took to technician Carolyn Boroden's charts to determine whether the uptick is just a one-off or if it's time to get bullish.
On Tuesday, oil prices closed just shy of a one-month high on news of a decline in U.S. crude and product inventories, with U.S. light crude settling at $51.03 a barrel.
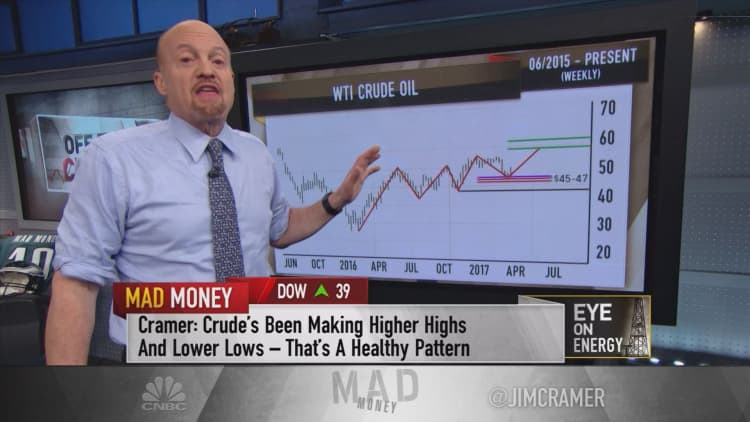
Boroden, Cramer's colleague at RealMoney.com and the technician behind FibonacciQueen.com, began by examining the chart of crude oil for any notable patterns.
She noticed that oil prices have been seeing both higher highs and higher lows, a healthy trend that could mean near-term upside if the pattern repeats itself.
"As long as oil can stay above its floor of support at the $45 to $47 area, Boroden believes it can go higher, and if it clears just a few more hurdles of resistance, then she wouldn't be surprised to see if crude ends up rallying from $50 and change all the way up to $57," Cramer said.
If oil prices are set to move up, there would be some technical clues in the stocks of big oil producers, so Boroden turned to their charts to determine any tangible effects.
Boroden typically tracks the size and length of past swings, and being the "Fibonacci Queen," runs them through a series of Fibonacci ratios to find key dates or price levels.
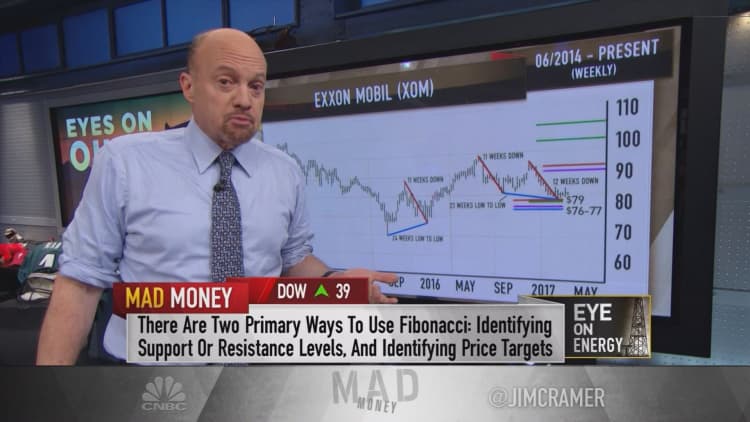
The charts of ExxonMobil and Chevron Corporation showed key support levels for both names. Exxon, which currently trades around $82, has one floor of support at $79 and a second from $76 to $77.
"She says that as long as the stock holds above at least one of these zones, then Exxon's more than likely to rally here. Boroden believes it could be smooth sailing up to the $89 to $91 area, with the stock perhaps rallying up to $99 if it can keep the momentum going," Cramer said.
Chevron, which trades around $108, also showed it has two support floors, one at the $104 to $105 level and another from $100 to $102. Boroden noted that Chevron's recent $106 low suggested the stock could be ready for a rally.
"Longer term, she wouldn't be surprised if Chevron can sail to $122," Cramer said.
But if either Exxon or Chevron break under their lowest floors of support, Cramer said Boroden's points are negated, and all bets are off.
Boroden's favorite two charts were from Pioneer Natural Resources and EOG Resources, two massive independent oil and gas producers.
The technician noticed that each of Pioneer Natural Resources' recent moves down were more or less symmetrical, and were each followed by a nudge upward.
"The key here is that these symmetry projections identify an important floor of support for Pioneer, running from $171 to $176," Cramer said. "Given the stock's recent run up to $187, that floor might not seem all that comforting, but as long as this support holds, then Boroden believes that Pioneer can keep climbing."
EOG, which currently trades around $97, showed a recent double-bottom pattern, giving Boroden insight into another floor of support between $91 and $93.
Cramer's bottom line? "The charts ... suggest that many of these oil stocks could be ready to take off given the recent rebound in the price of crude," he said. "If you believe oil can hold here or even keep rallying, then you've got to do some buying, and Boroden will turn out to be absolutely right."
Watch the full segment here:
Questions for Cramer?
Call Cramer: 1-800-743-CNBC
Want to take a deep dive into Cramer's world? Hit him up!
Mad Money Twitter - Jim Cramer Twitter - Facebook - Instagram - Vine
Questions, comments, suggestions for the "Mad Money" website? madcap@cnbc.com