


As oil prices slide while the market runs higher, Jim Cramer decided that it may be time to reevaluate the connection between crude and the stock market.
"After years of assuming that oil is, first and foremost, a barometer of the strength or weakness of our economy, it seems like traders may have finally figured it out. Maybe they've gotten it into their heads that right now, the fluctuations in the oil market have much more to do with supply than demand," the "Mad Money" host said.
With oil prices teetering around $46 a barrel, Cramer turned to the charts of technician Carley Garner, the co-founder of DeCarley Trading and his colleague at RealMoney.com.
In January, Garner said that the price of crude was stuck trading between the mid-forties and mid-fifties. Sure enough, after rallying to $55 in April, oil dipped back down to the mid-$40s on Tuesday.
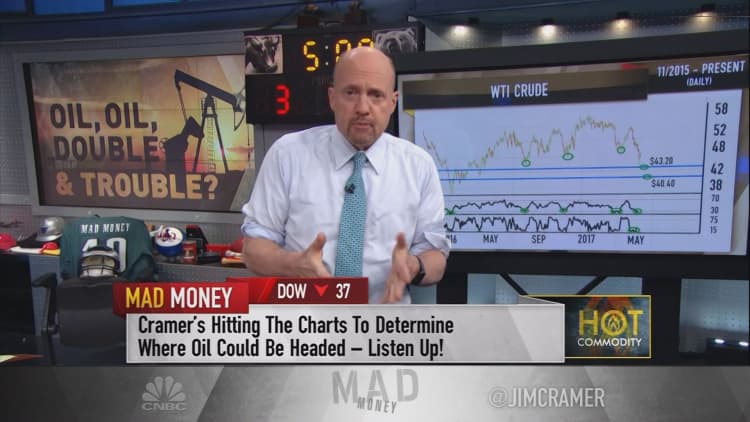
First, Cramer turned to Garner's chart tracking West Texas Intermediate crude over the last six months.
Garner noticed that the Williams Percent R oscillator, an indicator created by trading guru Larry Williams that shows when securities are overbought or oversold, put oil in oversold territory.
The Relative Strength Index, a key momentum indicator shown just below the Williams oscillator, showed the same.
"On previous occasions, Garner notes that oil eventually rallied out of holes like this one," Cramer said. "When crude gets ... this oversold, she says it's typically the kiss of a death for a bear market, although oil generally retests its lows or even makes slightly lower lows before rebounding. That's crucial. Garner suspects this time will be no different."
In short, Garner thinks the market could see oil tick even lower before bouncing. She noted that oil has two floors of support, at $43 and just over $40 a barrel, and if either holds on the next leg down, crude could start climbing back to $50.
"Remember, this is how it's been for months," Cramer noted. "We sell off to the $40s then we bounce right back to the $50s, over and over and over."
Oil's weekly chart supported Garner's theory. Crude prices tested several floors of support in the low forties, and both the Williams oscillator and Relative Strength Index showed it could have more room to fall before truly being oversold.
That means oil could trend lower for the time being, but easily rally back to $50 when it bounces without much resistance, Garner said.
While some say that oil's turn already happened when it hit $44 on Friday, Garner has reason to be skeptical.
With the help of the Commodity Futures Trading Commission's Commitments of Traders Report, the technician found that even after oil's decline, large speculators like money managers were maintaining their ultra-bullish positions, net long about 370,000 futures contracts.
The report was released last week, so Garner suspects that since then those contracts have likely dwindled down to 340,000 or 350,000, which Cramer said is still quite bullish.
"That means there could be liquidation ahead as the big boys capitulate. After the recent ten-point decline, you'd better believe these money managers are feeling uneasy," Cramer said. "That's why Garner believes crude could have yet another leg down to the low $40s before it can bottom."
Garner also pointed out that for most of the summer, oil tends to trade sideways, so the big players are still too exposed to buy more until they see real fundamental improvement.
Finally, a stronger dollar means cheaper oil because oil is denominated in dollars, and if the dollar index continues to see strong upward momentum, it could keep a lid on oil prices.
"Here's the bottom line: the charts, as interpreted by Carley Garner, who has been dead right, suggest that oil probably isn't finished going down," Cramer said. "But once it gets closer to $40 a barrel, she expects crude will be able to bounce right back, as it's done so many times before. What can I say? It's been a see-saw. I see no reason why that should change anytime soon."
Watch the full segment here:
Questions for Cramer?
Call Cramer: 1-800-743-CNBC
Want to take a deep dive into Cramer's world? Hit him up!
Mad Money Twitter - Jim Cramer Twitter - Facebook - Instagram - Vine
Questions, comments, suggestions for the "Mad Money" website? madcap@cnbc.com