The snowball of ETF asset growth is speeding up, thanks in large part to investors' obsession with cost.
We all took pause when the U.S. ETF market hit a record $287.5 billion in net creations in 2016. But consider that the asset haul on a trailing 12-month basis is currently $466.4 billion, according to Bloomberg data.
That's right. The ETF market has gathered nearly half a trillion dollars in the past 12 months alone. If this pace holds, the industry will hit that $500 billion-a-(trailing)-year mark before the summer is over. That figure is practically double what it was a year ago, and it's something the industry has never really seen before.
More from ETF.com:
Tech ETFs retreat: Pullback ahead
Here's what advisors are worried about
Muni ETFs: No summer vacation
It has also helped push the U.S. ETF market across the $3 trillion-in-total-assets mark this week. This is massive growth, and it could very well be the new normal.
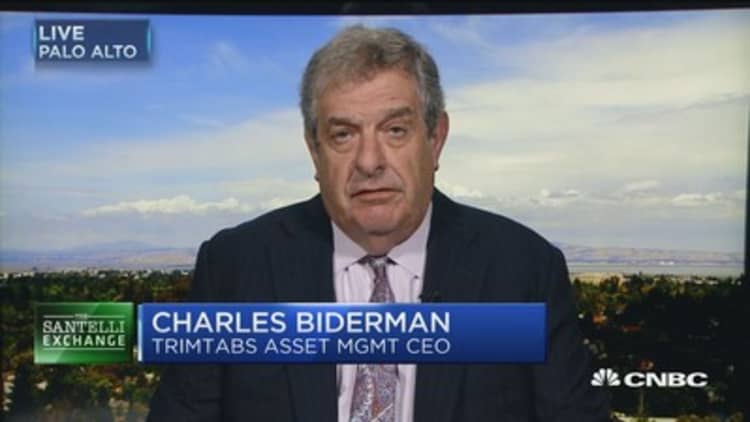
"You could say Trump kicked this off, and in the post-election euphoria, ETFs have gone from gathering $1 billion a day to $2 billion-$3 billion a day regularly," said Eric Balchunas, senior ETF analyst at Bloomberg. "But it's much deeper than the Trump trade now. There's a tipping point where advisors are switching over, institutions are using more ETFs because they are more liquid. There's more at play."
The 'mother of all trends': Cost
What's driving this growth? First and foremost, cost — "the mother of all trends."
"Cost has become almost an obsession because investors feel they can trust cost. They can't trust performance anymore," Balchunas said. "And in a low-volatility environment where everything is casually moving up together, cost is king."
The bulk of the net creations in the past year went into ETFs that cost 0.15 percent or lower. Among the most popular ETFs are funds like the iShares Core S&P 500 ETF (IVV), which saw $17.3 billion in inflows; the iShares Core MSCI Emerging Markets ETF (IEMG), which attracted $10.7 billion; and the Vanguard FTSE Developed Markets ETF (VEA), the Vanguard S&P 500 ETF (VOO) and the iShares Core MSCI EAFE ETF (IEFA), which each gathered more than $8 billion.
The cheapest of these ETFs, IVV and VOO, each carry an expense ratio of 0.04 percent. The most expensive of them, IEMG, has a 0.14 percent expense ratio.
The data also tell us that it is advisors and retail investors driving this asset growth. In an increasingly fee-based world — and one that now falls under the Department of Labor's fiduciary rule — low-cost ETFs make a lot of sense.
Big issuers get bigger
It also tells us that it is iShares and Vanguard pushing this train forward. A look at the biggest asset gatherers in the past 12 months shows that the top 25 most popular ETFs are either iShares or Vanguard funds, according to FactSet data.
They might not be the fastest-growing ETF issuers from a percentage gain perspective — the larger the total assets under management, the harder it is to see massive percentage growth — but their dominance as the No. 1 and No. 2 ETF issuers in the country goes on unabated. Among their most successful funds are their cheapest ETFs.
But there is also another interesting point that suggests institutions are playing a role in the ETF market expansion, Balchunas says.
Consider that IEFA was the fifth-most-popular ETF in the past 12 months, with inflows of $8.18 billion, but its counterpart, the iShares MSCI EAFE ETF (EFA), saw net creations of $8.03 billion—the sixth-largest. They are back to back.

These two nearly identical funds in terms of exposure are very different in terms of cost and liquidity. IEFA, part of the iShares Core lineup, has an expense ratio of only 0.08 percent, or roughly a quarter of what EFA costs — 0.33 percent.
But EFA trades more than $1.2 billion on average every day, at an average spread of only 2 basis points. The $77 billion fund is massive, and massively liquid. IEFA, meanwhile, trades only about $227 million a day, on average.
Their similar asset haul tells us that, while advisors and retail are pushing the growth of the lowest-cost offerings — this is the group that focuses mostly on cost — institutions too are driving gains of their own. They are turning to ETFs that are massively liquid, such as EFA, often as an alternative to derivatives and other instruments.
'Both kinds of investors'
"There are both kinds of investors in the market," Balchunas said. "IEFA is probably more asset-allocation, sticky money from retail and advisories, while EFA is institutional, hot money — the type of money that would also leave quicker on a scare."
ETFs still represent only about 1 percent of total institutional assets today. But it's a segment of the investor universe that is increasingly embracing ETFs, with names like Harvard and others making headlines for their growing ETF usage.
There's also the broader trend of investors moving from active to passive, and from mutual funds to ETFs.
Active mutual fund outflows hit $350 billion
While ETFs saw net creations of about $466 billion in the past 12 months, active mutual funds faced $350 billion in net outflows, Bloomberg data show. Index mutual funds, meanwhile, saw net inflows of about $200 billion in the same period — a gainer in the passive versus active race, but a net loser to the predominantly passive ETFs.
"There's a far stronger baseline and grassroots ETF usage among different investors," Balchunas said. "At this rate, we're going to soon hit $500 billion in inflows in a rolling 12 months, and ETFs need this kind of rate to get close to some of the market size projections."
ETF.com's Dave Nadig has projected $15 trillion in ETF assets by 2024; State Street has forecast $25 trillion globally by 2025.
— By Cinthia Murphy, ETF.com


