The S&P 500's daily price chart this year looks "eerily" like that of 1987, but that's about the only similarity between the market then and now, one of Wall Street's longtime market strategists pointed out.
"Indeed, when comparing the daily index levels for the in 1987 with the progression thus far in 2017, they appear to follow an eerily similar path," Sam Stovall, chief investment strategist at CFRA Research, said in a note to clients Wednesday.
Source: CFRA Research
"However, when the S&P 500 is viewed on a daily year-to-date price-performance perspective, 2017's relatively placid advance looks more like a long-term moving average than it does a mirror reflection of the surging/crashing action during 1987," Stovall said.
The S&P 500 has had a stellar year thus far, rising 14 percent to record highs. Investors have piled into stocks on growing hopes of U.S. corporate tax reform, an improving economic landscape and strong earnings growth.
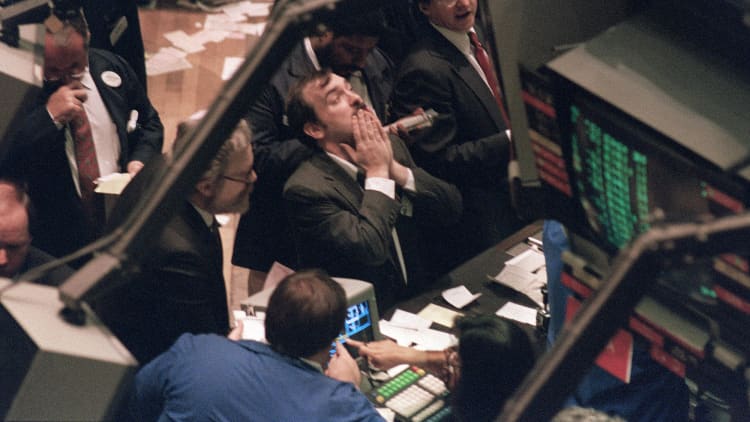
However, the S&P 500's seemingly unstoppable climb has rekindled memories of the infamous Oct. 19, 1987, market crash. On that day — which is known on Wall Street as "Black Monday" — the S&P plunged 20.5 percent, marking the biggest single-day drop in U.S. stock market history.
But Stovall said there are key differences between this market and the one from 30 years ago.
First, the market this year is not exhibiting the same signs of euphoria it was back in 1987. He pointed out that 95 percent of the S&P 500's sub-industries were higher before the crash. In 2017, just 73 percent of those sub-industries were higher.
Stovall also pointed out that this bull market is much older than the one that ended in 1987. This bull — which began in 2009 — is 103 months old, while Black Monday marked the end of a 60-month bull market.
He also noted that interest rates are much lower now than they were 30 years ago. The Federal Reserve's overnight rate hovered above 7 percent back in 1987. Today, the overnight rate sits in a range of 1 to 1.25 percent.
"Investors understandably experience an elevation of anxiety when the current bull market is mentioned in the same breath as the 30th anniversary of the Crash of 1987. But history indicates that this comparison is not warranted," Stovall said.
WATCH: Could the 1987 crash happen again?