


The most simple and reliable chart pattern out there is one that CNBC's Jim Cramer dreads.
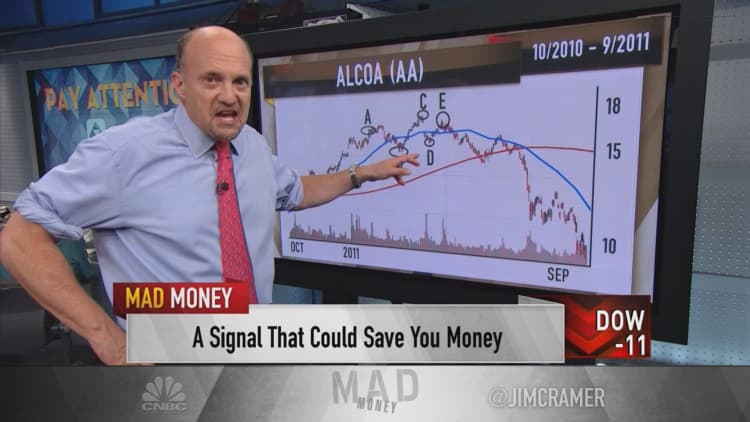
Unfortunately, Cramer learned not to ignore the head-and-shoulders pattern the hard way when his charitable trust bought Alcoa — which spun off its aluminum business in November 2016 under the name Alcoa and is now known as Arconic — in 2010, when the stock price was in the low teens, and ultimately took a loss because it was too early to buy.
"Yes, just like a human's head. That is the most frightening pattern in the chart book," the "Mad Money" host said.
Shares of Alcoa saw a healthy run from the winter of 2010 to February 2011, rising from $13 to $17. The stock ran to $18 on the eve of its quarterly earnings report, and Cramer thought it was a fine quarter when it reported.
What worried him was that even after an initial positive reaction, the stock dropped. Several days later, however, Cramer assumed it would take out its $18 level and went back to buy more.
But Cramer was wrong — extremely wrong.
What the "Mad Money" host did not realize is that the fluctuation in price had traced a perfect head-and-shoulders pattern.
It turns out that during the time when the head-and-shoulders pattern was forming on Alcoa's chart, Europe and China's markets started to slow down, sending aluminum into a glut.
Ultimately, while former CEO Klaus Kleinfeld could control his own company, he could not control the price of the commodity itself.
But when a stock manages to break out of the dreaded head-and-shoulders formation, that signals the opposite — a chance for glory.
"The key with this pattern is the neckline, the line that connects the high to the two shoulders. When a stock breaks out above that line, it tells a technician that you are about to witness a big move higher," Cramer said.
At the end of the day, patterns matter. So when you see a head-and-shoulders pattern, no matter how confident in the stock you might be, Cramer believes you should sell. And when the reverse head-and-shoulders develops, then you should consider buying.
That is just how powerful these moves are. The chart work is more often right than most would ever think possible.
WATCH: Cramer's most dreaded chart pattern
Questions for Cramer?
Call Cramer: 1-800-743-CNBC
Want to take a deep dive into Cramer's world? Hit him up!
Mad Money Twitter - Jim Cramer Twitter - Facebook - Instagram - Vine
Questions, comments, suggestions for the "Mad Money" website? madcap@cnbc.com