


After a brutal rotation out of the technology stocks that came on the heels of the Senate passing its tax reform bill, CNBC's Jim Cramer wanted to check in with tech.
Tech stocks recovered on Tuesday after Monday's storm of selling, caused in part by investors trying to buy shares of domestic companies that stand to benefit from corporate tax reform.
So Cramer called on technician Carolyn Boroden, one of his colleagues at RealMoney.com and the brain behind FibonacciQueen.com, to help him get a better outlook on the tech sector.
"Specifically, we're going to drill down into the action in the now-despised and left-for-dead roadkill that are Facebook, Apple and Netflix," the "Mad Money" host said. "The big question: when we look back on this moment a year from now, will the pullbacks in these stocks look like fabulous buying opportunities?"
Boroden's methodology for predicting these moves might seem obvious. She uses ratios developed by medieval mathematician Leonardo Fibonacci, who discovered that certain patterns repeat themselves in nature in things like snail shells and pine cones.
Funny enough, these patterns also tend to show up in the stock charts. The Fibonacci Queen's specialty is looking at past swings in a given stock or index and applying the ratios to find when a stock might change trajectory.
"I know it sounds like pseudo-science, a kind of stock market astrology or alchemy, but the fact is, it does work," Cramer said.
And when it comes to the stocks of Netflix, Apple and Facebook, Boroden found that all three recently reached key Fibonacci extensions of their prior swings.
In plain English, that means the stocks repeated an entire previous move, then ran up some more, which Boroden often takes as a sign to get more cautious.
Looking at the weekly chart of Netflix, Boroden liked that the stock's latest pullback was very similar to its last few declines.
Netflix's stock lost roughly $27 in its last pullback in late summer. In the pullback before that, it also shed about $27. Last week, it lost $26, meaning the most recent decline could be over.
Better yet, the $27 declines were followed by much bigger rallies that made up for the declines and then some. While that might not necessarily happen again, Boroden was confident that if Netflix's $177 to $178 floor of support holds, the stock could run to $211 a share.
"However, if Netflix does start falling again and breaks down below the floor of support, the next one is at $167 to $168 — that's the level to watch if the big tech sell-off picks up again," Cramer said.
Just like with Netflix, Apple's weekly chart suggests the stock is experiencing a "garden-variety pullback," Cramer said.
Apple's last few pullbacks each lasted for about $14, meaning the now-$170 stock could decline to $160. But the stock has so many floors of support between $170 and $160 that Boroden isn't worried.
"There's the floor at $166 to $167, another floor at $164 and $165, and there's one at $159 to $161," Cramer said. "That's a lot of areas where things could turn again, and the stock's rallied slightly today so it's possible that the pain is already over."
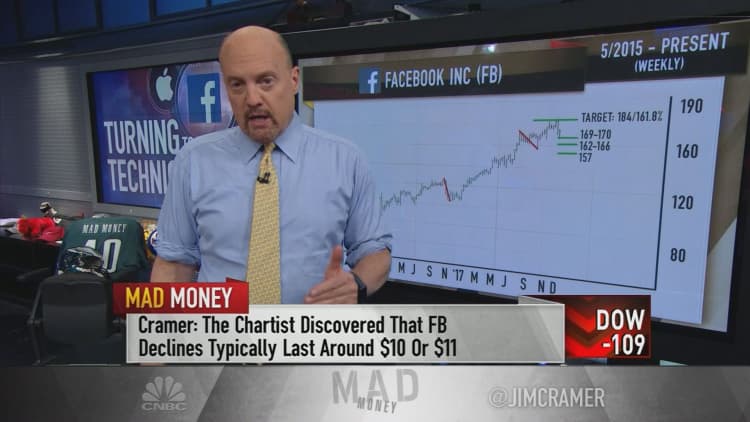
Like the others, Facebook's last few pullbacks of $10 or $11 suggested that the stock's current decline — down over $10 from where it traded a week ago — might be done after today's rally.
That said, Boroden did point out some levels to watch for Facebook: one floor of support from $169 to $170, another from $162 to $166, and a third at $157.
"As long as the price holds above one of these floors, even the lowest one, Boroden's optimistic," Cramer said.
All in all, Fibonacci ratios, especially when imparted on stocks by the Fibonacci Queen, can be so predictive that they're "almost creepy," the "Mad Money" host said.
"The charts, as interpreted by Carolyn Boroden, suggest that the recent declines in Netflix, in Apple and in Facebook are really nothing to get too worked up about," he concluded. "My view? These tech titans may not be in the sweet spot to benefit the most from tax reform, but they're still fabulous companies. I'd use any further weakness to gradually buy some more on the way down, even as they've been thrown away as if they were never worth anything to begin with."
WATCH: Cramer's charts on tech 'roadkill'
Disclosure: Cramer's charitable trust owns shares of Apple and Facebook.
Questions for Cramer?
Call Cramer: 1-800-743-CNBC
Want to take a deep dive into Cramer's world? Hit him up!
Mad Money Twitter - Jim Cramer Twitter - Facebook - Instagram - Vine
Questions, comments, suggestions for the "Mad Money" website? madcap@cnbc.com