


Biotech has been quietly breaking out, now up more than 10 percent from its April lows. And one top technician sees an even bigger breakout ahead.
The biotech industry has been under scrutiny in the past year as President Donald Trump's plan to lower drug prices has put pressure on the stocks. Nonetheless Carter Worth, head of technical analysis at Cornerstone Macro, says there's something in the charts signaling more gains for the group.
Worth first alludes to a five-year chart of the XBI ETF, highlighting a recent break above its 2015 highs, a key level around $90. The equal-weighted ETF is up 13 percent this year, getting a boost off the strong performance by smaller-cap biotech stocks.
On the contrary, the larger cap-weighted Nasdaq IBB ETF has been dragged down by the underperformance in big names like Biogen, Amgen and Celgene — which make up more than 23 percent of the ETF's holdings. However, Worth believes the group is due for a catch-up.
"It's the larger names that have lagged," Worth said Friday on CNBC's "Options Action" "But my hunch is that these names are actually going to start to catch up."
Both biotech ETFs, which typically trade in correlation with the other, are up double digits in the past five years. However, due to a recent divergence, the IBB has only seen half the gains of the XBI ETF – which is up 160 percent in that time frame.
"My thinking is that [the] large-cap IBB is the way to play it, it's got some upside here," he said.
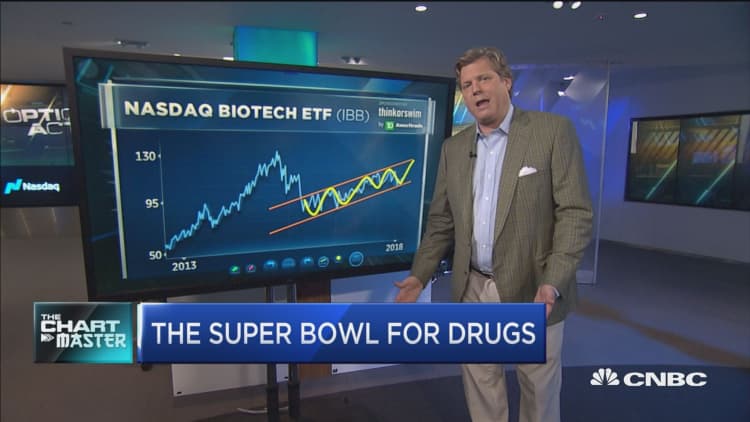
While the IBB has rallied more than 82 percent since 2013, the group has been an underperformer relative to the broader health-care sector. Yet, Worth believes the ETF's recent break above that three-year downtrend could be indicating some upside ahead.
"The beginning of relative outperformance to its sector and the spread with the small cap suggest to me that's there's more to go," he said.
Furthermore, Worth highlights a "perfect" uptrend channel in the IBB from its 2016 lows. This technical indicator suggests the group could now be heading toward the top of the channel, around $125 or more than 10 percent higher from its current levels.
"My thinking is that we're at the low end and we're headed to the high end. So I want to be long IBB here," Worth said.
The IBB traded lower Monday, closing at $109.13.


