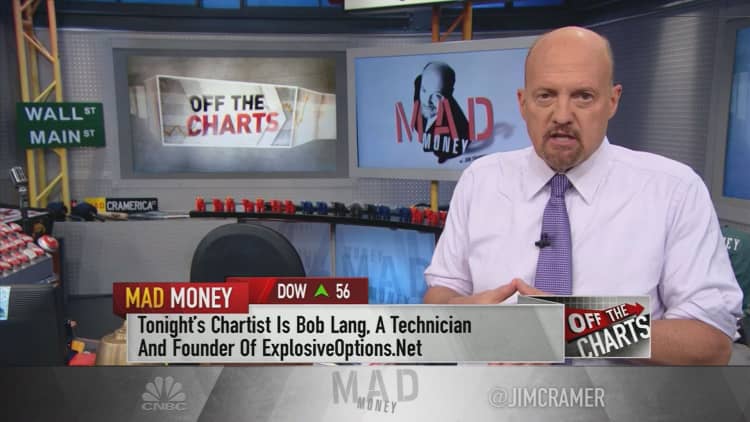
CNBC's Jim Cramer was somewhat surprised to see the biotechnology sector bounce back in 2018 after months of weakness.
"At a time when President Trump keeps slamming the pharmaceutical industry over excessive drug pricing, ... you might think that the biotech stocks should be getting slaughtered," the "Mad Money" host said on Tuesday.
"But you know what? After spending a long time in the doghouse, biotech as a whole is actually having a pretty darned good year, with the Nasdaq Biotechnology ETF, the IBB, up 17 percent for 2018," he continued.
To make sense of the biotech stocks' new leadership role, Cramer brought in technician Bob Lang, the founder of ExplosiveOptions.net and part of TheStreet.com's Trifecta Stocks newsletter team.
Lang, who uses technical tools to track the action in particular stocks, decided to look at the group's most recent leaders and laggards, beginning with the daily chart of Gilead Sciences.
But Lang noted that in the last few months, particularly after Gilead's $11.9 billion acquisition of cancer immunotherapy play Kite Therapeutics, its stock has been bouncing, logging higher highs and higher lows.
Gilead's stock has managed to break through its 50- and 200-day moving averages as well as its former ceiling of resistance, and key momentum indicators like the Relative Strength Index have surged into positive territory, Lang said.
Better yet, Gilead's moving average convergence-divergence indicator, which technicians use to predict changes in a stock's trajectory, recently made a very bullish crossover, telling Lang that the stock could be prime for a rally.
"The stock is overbought right here and the next ceiling comes in at around $82, up $5 bucks from these levels, but given everything else he sees in the chart, Lang believes Gilead can keep climbing," Cramer said. "In fact, it’s his favorite name in the group and he wouldn’t be surprised if it starts challenging its old highs of around $110 by the end of the year."
Next, Lang turned to the daily chart of Celgene, a biopharmaceutical giant with a focus on treating cancer and inflammatory disorders.
Lang started by inspecting Celgene's Chaikin Money Flow, which measures levels of buying and selling pressure in a stock. Not long ago, this indicator turned green, indicating to Lang that institutional buyers were warming up to the stock. He added that the stock has made a "W" formation of late — another bullish signal.
"Right now, the stock’s at $86. [Lang] thinks it could make a move to the 200-day moving average, ... currently around $97 bucks, in the coming weeks," Cramer said. "He may be right given the recent rotation into biotech. Without the rotation, though, I’m less sanguine."
Lang also threw a third name into the mix — Illumina, a biotech-oriented medical technology company that builds machines for DNA analysis with one of the best-performing big-cap health-care stocks since 2017.
The only issue seemed to be that the stock was overbought, but that didn't shake Cramer or Lang.
"This thing, though, has been overbought very frequently since 2017. Now, that has never been a reason to sell the stock," the "Mad Money" host said. "Instead, you’ve done much better if you simply wait for the next pullback — and we get those all the time — and use that weakness to do some buying."
Lang's analysis echoed that point, recommending that investors use weakness in Illumina's stock to buy and strength to sell.
"The biotechs and the biomed techs have finally started showing some signs of life and the charts, as interpreted by Bob Lang, suggest that Gilead, Celgene and Illumina have more room to run," Cramer said. "My view? Look, if you believe the economy is going to stay strong, then maybe this rally does peter out, but you’ve got my blessing to put on some exposure on any one of these or all of them, as I think Lang is going to be dead right."
WATCH: Cramer's charts show signs of life for Gilead, Celgene and Illumina

Questions for Cramer?
Call Cramer: 1-800-743-CNBC
Want to take a deep dive into Cramer's world? Hit him up!
Mad Money Twitter - Jim Cramer Twitter - Facebook - Instagram - Vine
Questions, comments, suggestions for the "Mad Money" website? madcap@cnbc.com


