


Wall Street's anxieties took a new turn Thursday after the stock market broke below a key technical level that has supported the market for the past three years.
The finished the day below its 200-day moving average, one of the most popular technical indicators used by investors to help analyze price trends. Sell-offs earlier this year — occurring in February, March and April — all had bottomed at that level.
The metric, the average price of the last 200 days, is often considered a barometer of whether securities are in a healthy long-term trend.
"As I have said multiple times, I start to pay attention when the market cracks its 200-day moving average," wrote Brad McMillan, chief investment officer for Commonwealth Financial Network. "This break of a long-term trend line is definitely something worth noting. It doesn't happen that often, and it can be a sign of more trouble ahead."
But while it's uncommon and often jarring for the S&P 500 to break through the technical level, such a move lower is often followed by a quick snap back.
"Here again, though, this is a reason to pay attention but not to panic. The market broke through the trend line several times on a daily basis earlier this year and in 2016, only to bounce back up," McMillan added.
McMillan was echoed by Robert Sluymer, technical strategist at Fundstrat Global Advisors, who noted that the S&P remains in a long-term range that has seen the markets hit new records over the past two years.
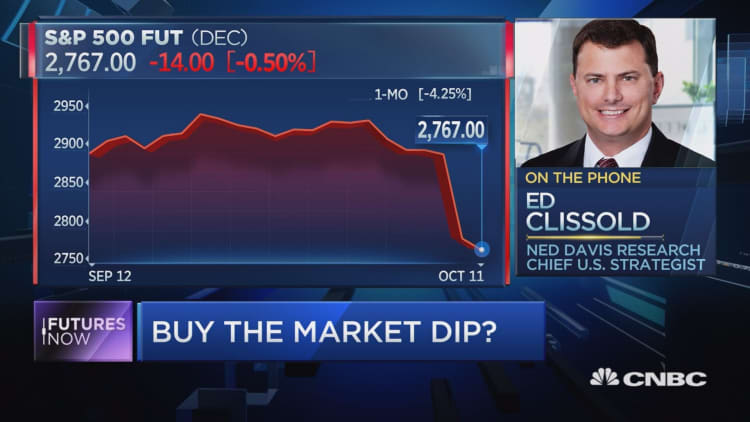
"The uptrend that began in 2016 is still intact, but we're testing that now," said Robert Sluymer, technical strategist at Fundstrat Global Advisors. "My point is now that market is moving into a serious band of support around 2,700. ... The momentum data it's really oversold down at these levels."
Sluymer also said he wouldn't be surprised to see the broader market work to carve out a bottom in choppy trading over the next several days as the third-quarter earnings season gets underway.
So if we bounce back above over the next few days, traders would be less concerned.