A technical signal bubbling underneath the roiled market's surface could portend more pain for stocks, BofAML's Stephen Suttmeier says.
Contracting margin debt coinciding with a market peak suggests rising risk-off sentiment, says Stephen Suttmeier, chief equity technical strategist at BofA Merrill Lynch Global Research. A similar setup was seen before the most significant market crashes of this century.
"In 2000 margin debt topped out. Basically oxygen coming out of the market, people less willing to take risk and that had an impact. You had a higher high in the S&P and then it was lights out until about 2002. The same thing happened in 2007," Suttmeier said on CNBC's "Futures Now" on Tuesday.
Margin debt measures how much a trader borrows from a broker to finance a trade. Margin debt petering out as stocks hit new highs suggest a flimsier rally and fewer investors willing to take on more risk, says Suttmeier.
"The risk is if margin debt continues to fall here we could be in a sell-strength market," he added.
On top of that, the wave of punishing sell-offs this month has dragged the down from its record high set just over a month ago. The benchmark index is down 8 percent this month, its worst performance since May 2010.
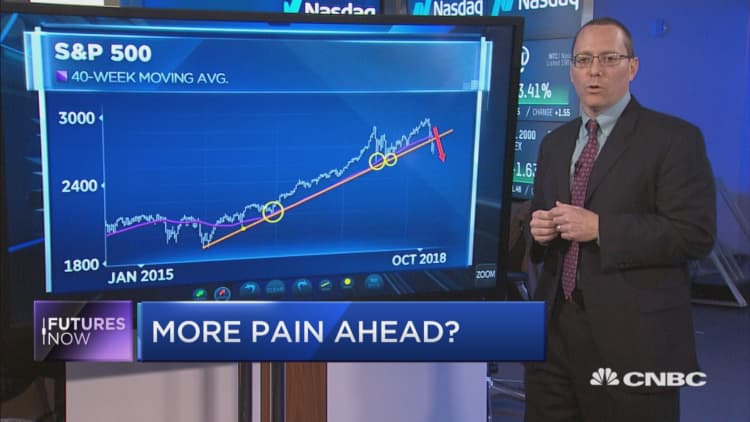
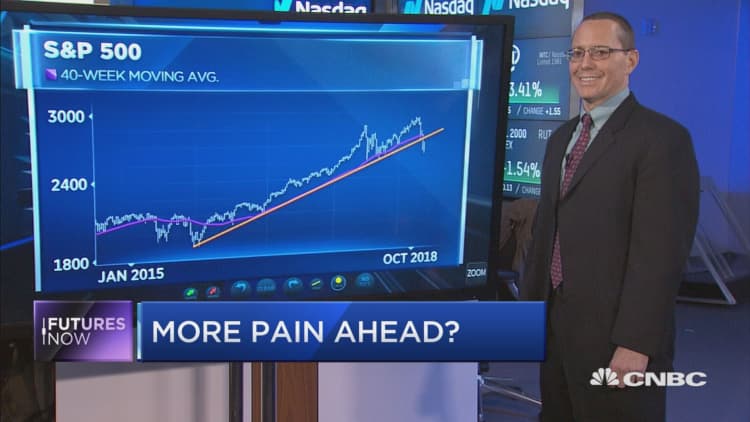
"An important level has been broken: the 40-week moving average and the uptrend that goes all the way back to early 2016," Suttmeier said. "This is not a good sign. … You can get rallies here and there but when you think about what has happened here, investors are pretty darn bearish."
The S&P 500 had broken firmly below its 40-week moving average into the Brexit vote and the 2016 presidential election, two major risk-off events. It also bumped below during the sell-offs this past February and March but quickly recovered.
Suttmeier marks key support level for the S&P 500 at 2,600, a level it touched during Monday's sell-off. If it breaks that, Suttmeier sees the next level of support coming in at the 2018 lows at 2,532, still a 6 percent decline from Tuesday's close.