


The stock market's recent swings might not be as bad as investors think, especially when stacked against their historical performance, technical expert Rob Moreno told CNBC's Jim Cramer on Tuesday.
After consulting the charts of the major averages, Moreno, the publisher of RightViewTrading.com and Cramer's colleague at RealMoney.com, concluded that stocks are in a consolidation phase, trying to digest the gains from a multi-year bull market.
And "the charts, as interpreted by Rob Moreno, suggest that the averages are trying to bottom here in preparation for a nice rebound," Cramer, host of "Mad Money," told investors.
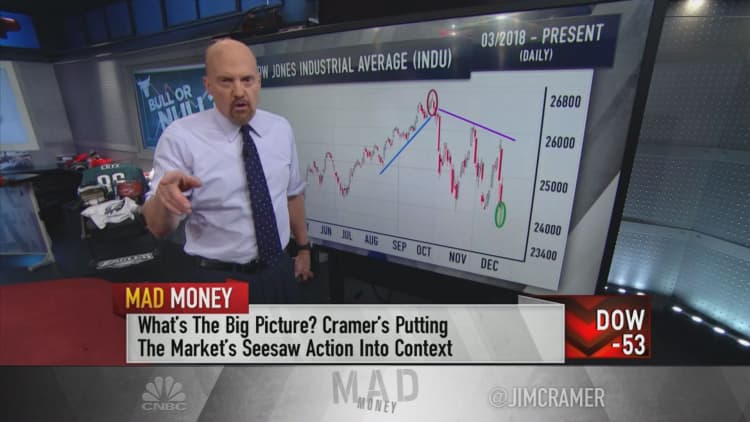
Cramer pointed out that since the end of the financial crisis, the averages have climbed steadily higher. The Dow Jones Industrial Average, for one, bottomed at roughly 6,500 in March 2009 and has since traded above 24,000.
But this consolidation period is atypical, Cramer admitted. Normally, times like these "tend to be sedate [and] fairly limited" when it comes to trading; this one has been much more volatile, or prone to big swings, he said.
According to Moreno, "the best way to navigate your way through it is by taking a wider view of the landscape, because that's the only way you can get enough ... perspective that you won't panic," Cramer said. "Sure, the decline's been brutal, but he says we've been through previous consolidation periods that were even more volatile and they didn't derail the bull."
First, Cramer turned to Moreno's logarithmic chart of the Nasdaq Composite index. Technicians use logarithmic charts, which measure percentage moves rather than basis points, to compare market action over long periods of time.
"Moreno points out that in 2010, 2011 [and] 2015, there were periods of consolidation that had even wider ranges than the one we're experiencing now," Cramer said. "Even though the Nasdaq's lost a lot of points here, on a percentage basis, the 16 percent decline [from its October highs to its November lows] is smaller than 2010, 2011 or 2015, and each of those times, the market ultimately rebounded phenomenally."
Moreno also noted the major averages' floors of support and ceilings of resistance, key levels that technicians watch to know when a given index or stock might change course.
The weekly chart of the showed a ceiling of resistance at 2,800 and a floor of support between 2,550 and 2,600, a range in which that index has been stuck all year. The Dow's weekly chart had a ceiling at 26,000 and a floor between 23,500 and 24,000, not far below where the Dow was trading on Tuesday.
"In Moreno's eyes, it looks like the Dow and the S&P are both trying to hammer out a bottom," Cramer said. As for the Nasdaq, which is trading in the middle of its range, "Moreno wants to see what's known as a hammer candle, where ... the Nasdaq rallies and closes on Friday near its highs for the week. That would send a signal that the bottom will hold and perhaps we could rebound back to the high end of the range."
The best part — at least for investors who believe Moreno's call that this isn't a bear market, but a consolidation phase — was that even if the averages fall below their floors of support, this is likely still a buying opportunity, Cramer said.
"If you have conviction, you might want to do some buying, seeing as the major averages are all pretty close to their floors of support, and even if these floors are violated, Moreno doesn't think we'll have a whole lot more downside," he said.
Moreno added that buyers should watch for what's called an eveningstar candle pattern to make their move: in short, it's a three-day phenomenon when the market rallies for a day, maintains a tight trading range the next day, and then sees an unusually negative trading session.
All in all, "Moreno thinks that the situation might not be as bad as it seems," Cramer said. "This all sounds a little too sanguine for me given everything that's going on, but you know what? I think it's heartening to put these declines in a more constructive perspective."
WATCH: Charts show major averages nearing bottom
Questions for Cramer?
Call Cramer: 1-800-743-CNBC
Want to take a deep dive into Cramer's world? Hit him up!
Mad Money Twitter - Jim Cramer Twitter - Facebook - Instagram - Vine
Questions, comments, suggestions for the "Mad Money" website? madcap@cnbc.com