The Russell 2000 is having its best start to the year since 1987.
The index of small-cap stocks has gained more than 8 percent year to date — a far cry from its 2018 performance, when the index saw its worst annual loss since the financial crisis.
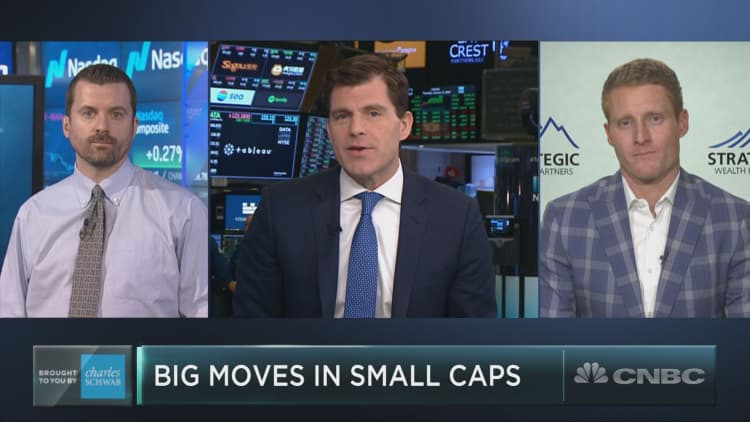
But the recent strength may just be a head fake. According to TradingAnalysis.com founder Todd Gordon and Strategic Wealth Partners' Mark Tepper, investors should look elsewhere for value.
"Small caps were way oversold, but now they've outperformed since the market bottomed in December," Tepper said Thursday on CNBC's "Trading Nation." "But in this stage in the economic cycle, I'd be favoring large caps over small caps."
Smaller companies are typically more susceptible to economic cycles. They usually hold more debt than their large-cap peers, which means they are especially sensitive to factors like rising rates and wage inflation.
Since Tepper believes we could be nearing the end of this historic bull run, he thinks Russell 2000 companies might have a tough road ahead.
"Large caps typically outperform small caps late cycle," he said. "When the economy slows and eventually contracts, those companies with high debt levels are going to get hit the hardest. Cash flow slows, rates go up, and that's a recipe for trouble. Beyond that, wages are going up and that's going to eat into margins."
Despite the strong start to the year, the Russell 2000 is still in correction territory, with shares more than 16 percent from their record high last August.
Like Tepper, TradingAnalysis.com founder Todd Gordon doesn't believe the index is firmly in an uptrend. After examining a chart of the IWM, an ETF that tracks the index, he doesn't think it's about to break out to the upside. He is, however, watching one key level as a potential strength indicator.
The IWM's 200-day moving average is $158, which is about 7 percent higher than where it was trading Thursday. To reach that key level, Gordon says, it will first have to break above its October and November lows.
"The 200-day moving average is right around $158, so we have some wood to chop to get to retest that moving average which was lost," he said. "We have old lows here in October and November. That's going to be overhead supply. Anybody who bought those lows would certainly be selling or offering into those levels. So we've got to chop up through there."
If the IWM can top that key $158 level he thinks that "new longs coming in" could potentially drive the ETF higher. It was above $146 in Friday;'s premarket.


