


Stocks are up an awful lot in a big hurry. The has jumped more than 13 percent in 17 trading days to recover more than half its roughly 20-percent fourth-quarter collapse.
Also, the market is down a bunch: The S&P is off close to 9 percent since September, and half of all stocks across the market remain 20 percent off their peak.
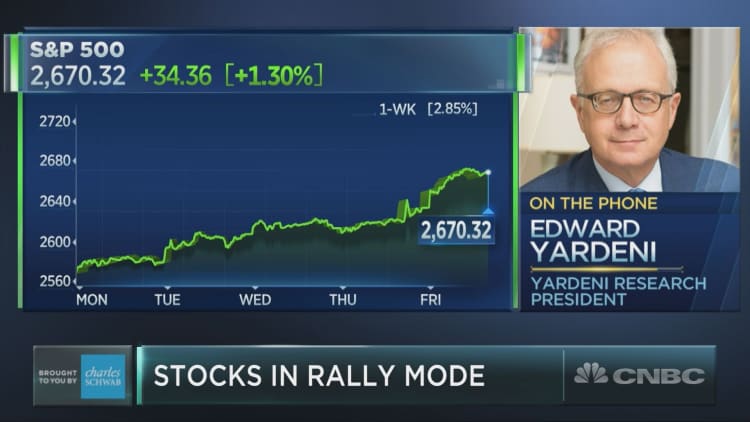
At the same time, stocks have gone nowhere. The S&P closed Friday at 2,670, within three points of where it finished 2017 — marking a nearly 13-month round trip of whippy trading and shifting story lines.
So to sum up, the market is running quite hot in the very short term, as big, tactical traders have lunged to add market exposure as the indexes bounced back powerfully. Yet there remains plenty of dented, discounted merchandise strewn about in stocks after December's comprehensive drubbing created a downside overshoot.
And the S&P returning to where it started last year serves as a kind of do-over for investors, who can now assess the current outlook compared to how things appeared entering 2018 — and also to how they looked near the end of October, when the S&P paused at this level briefly right as the October correction accelerated into a deeper panic.
Let's dial it back to Dec. 29, 2017, the final trading day of a year when the S&P gained 20 percent in one of the least-volatile performances in market history. At 2,673, the index closed just a touch off its record high set weeks earlier.
The corporate tax cut had passed only a week earlier, and analysts had not yet built it into profit forecasts. The market refused to wait, surging by 7 percent in the next three weeks in a climax of optimism and overconfidence that would set up the first of two bruising downturns in 2018.
On paper, the S&P at 2,673 at the end of 2017 traded near 18-times 2018 earnings, then projected at $150 a share. In fact, 2018 earnings ended up much higher, so that the market was actually trading at 16.5-times the $161 level where 2018 profits now sit.
As of now, 2019 estimates are sliding and sit some 6 percent below where they were in October, but remain above $171 —placing the current multiple at 15.5. It suggests that there is a bit more of a valuation cushion now than a year ago.
Does that mean the cushion is thick enough to absorb a worsening of the slowdown/earnings-downgrade pattern from here? Or that it is enough to free Wall Street from the nagging concern that even another year of growth in corporate profits leaves us uncomfortably close to the expansion's end?
Thirteen months ago investors expected three Federal Reserve rate hikes and thought the economy could handle them. They ended up getting four rate hikes. But since the market traded at today's level in October, the Fed has softened its tone about 2019 and the market has gone almost so far as to price out any hikes for this year.
The big questions for the coming months:
— How wide a path has been opened up between an economy that ends up wobbling back toward stall speed, and one that continues to grow above the long-term trend but without a heavy threat of an aggressive Fed?
— What valuation is comfortable for a stock market that many investors saw, right or wrong, as deeply vulnerable to one errant quarter-point boost in short-term rates?
— And finally: Would you rather own the S&P at 2,670 when everyone is excited about a runaway growth boom, emboldened by low volatility and piling into momentum stocks (the case 55 weeks ago) or now, when the earnings base is higher but growth fears are pervasive, high volatility has shredded nerves and most stocks have been marked down heavily?
Arguably, the government shutdown is a help to those who see the Fed as the key threat to risk assets. A month without timely government economic data and the muddling, if temporary, effects on growth would seem to only add to the Fed's patience level in coming months.
Perhaps this observation is part of why the market has sped higher in recent weeks, outperforming by far the average "bear-market rally" and even bettering the typical surge that starts a bull market, according to Leuthold Group.
On a tactical level, it's now easier to view the rally as simply reversing the final, exaggerated selling capitulation in the final weeks of 2018, with systematic trading strategies and stay-at-home asset allocators alike feeling themselves under-exposed to equities right out of the gate in January.
But with the market now back challenging its longer-term trend (sitting directly at its 80-week moving average, in fact), the immediate risk looks to be for some backsliding.
Jonathan Krinsky, chief market technician at Bay Crest Partners, is among those noting that the breadth and persistence of this rally ranks among some of the more consequential upturns on record. Among S&P 500 stocks, 71 percent are at a four-week high, the most since October 2011.
When this reading has exceeded 60 percent, the S&P has always been higher a year later. (Krinsky correctly cautions that last year violated several "rules" that had previously worked 100 percent of the time — such as December never before having been the year's worst month.)
Yet in the nearer term after such signals, some give-back has been common. The average return one month later has been negative, in fact.
And fast-money psychology has quickly shuttled to greed from fear. The Daily Sentiment Index of professional traders showed 73 percent bulls to end last week, up from a mere 4 percent on Dec. 24.
Which simply means, from here, it would be more surprising if the market keeps whistling higher than if it slips back a bit, as investors mull what to do with the market's offer of a do over.


