The markets have surged into the new year with the Index posting its best January in more than three decades. Investor optimism of late has been fueled by a stronger-than-expected earnings season, and a Federal Reserve that is expected to pull back on plans to hike interest rates.
The S&P 500 is now up more than 15 percent from its December 24 closing low. Jason Hunter, technical strategist at JPMorgan, told CNBC recently that new highs could be on the way.
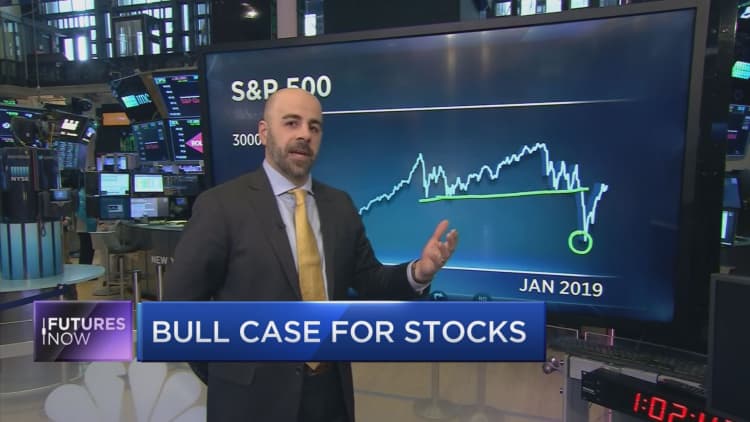
"It's very clear anyone who looks at charts for a living or even casually, you had a very clear well-defined support that held through most of the year and then a fairly violent breakdown through December," Hunter said Thursday on CNBC's "Futures Now."
Given the recent rebound, Hunter noted that the S&P 500 is "right back into the underside of what potentially is viewed as a distribution pattern," which is giving him flashbacks to 2000 and 2007.
"The rebound we've had to-date…[is] consistent with 2000 and 2007…but I think it's worth noting that you see that type of price action outside of bear market environments as well," he explained. He noted that historically, when the market are as deeply oversold as they were in December, the following 6 to 12 months have a positive lean.
"But it's worth noting that this is a bi-model distribution, so we're left in the uncomfortable position to qualitatively decide is this a bear market rebound, or is this part of a sustained move where we're going to get up to see a new high for the cycle before we move into let's say a recession –driven environment," the analyst said.
"And unfortunately....there's no real difference between the price action in a bear market, or in a bull market in a volatile environment, and that's where we have to move and look outside to other indices," he added.
According to Hunter, one way to differentiate whether the market rally of late is a bull run revival, or just a bear market bounce, is to look at the chips.
The Philadelphia Semiconductor Index (SOX) -- which tracks 30 public companies aligned with the manufacturing and distribution of chip stocks -- has posted significant gains so far this year up more than 10 percent.
While the index also fell alongside the broader markets in December, Hunter's chart reveals that on a relative basis "it actually bottomed in mid-November as the trade talks started to get underway."
Hunter considered the SOX index a leading indicator for market direction due its correlative nature with PMI numbers. The Purchasing Managers Index is often regarded by investors as a key gauge of overall economic health.
"Even if semis continue to rally like they have that would suggest from a model correlation perspective that PMI data is not going to look that hot this month and even next month," he explained. "[However] the outperformance gives us a positive lean that suggests the policy response we've seen out of the Fed, Chinese stimulus and the potential to get to a better spot where the trade negotiations are."
Although trade tensions and looming slowdown fears have put pressure on global manufacturing numbers of late, Hunter's theory suggests the semiconductor gauge tends to lead by about 1-2 months.
"The policy responses we've seen again out of the U.S. and China kind of fits with the technical story," he said. "Where this is more of a sustained rally into at the very least in the third quarter when S&P can approach its highs again."