Stocks have been making their big comeback.
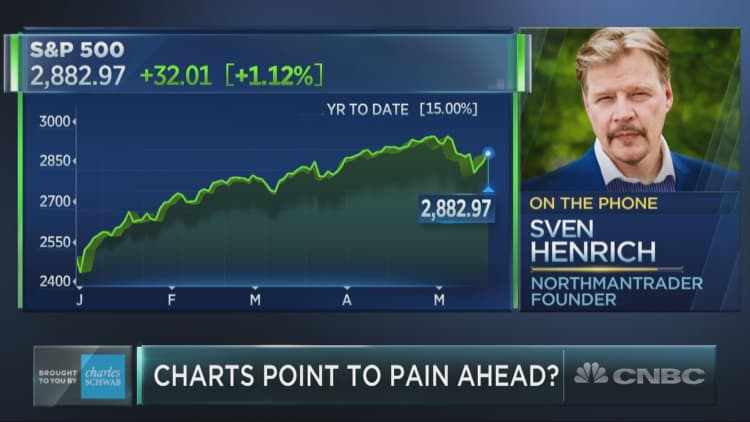
The clawed its way back from the worst of May's losses and turning positive for the week as of Thursday's close. Markets had taken a sharp turn lower earlier this month as the U.S. and China hiked tariffs on one another and kept a trade deal out of reach.
Despite the reprieve, NorthmanTrader founder Sven Henrich said Thursday the underlying technicals tell a different story. Indeed, futures prices on the three major indexes were projecting lower openings Friday morning.
"When we look at the charts, we have to recognize that markets may be in the process of repeating some of the sins of the past that we saw last year," Henrich said on CNBC's "Trading Nation." "We had an incredibly powerful rally, especially on the [Nasdaq 100] that created rising wedge patterns. This was exactly the same pattern we saw last year that ultimately broke to the downside."
The QQQ ETF, which mimics the price action on the Nasdaq 100, had rallied nearly 30% from its Christmas Eve lows to the end of April. Since hitting a record high on May 1, it has pulled back more than 3%.
"We got the first initial correction of 2019 about 5% on the S&P, 6% on the NDX. In general, it's kind of a smaller pullback but it packed a pretty good punch because we also saw a big breakout in volatility, so it structurally looks almost like a repeat from last year and last year obviously we saw a lot of chop for a few weeks before we saw another leg lower," he said.
The S&P 500 is also forming some bearish patterns, including two broken rising wedges. The megaphone pattern created by a widening price range also points to an erratic market rather than a stable ascending bull market, he said.
The narrow participation in the market rally this year also concerns Henrich.
"We made a new high just recently on the S&P and on the NDX but not on any of the other major indices — the Dow did not, the small caps, the NYSE, banks and so forth, and now we've given away on these gains again," said Henrich.
The Dow Jones Industrial Average, for example, has not reached a new high since Oct. 3, while the IWM Russell 2000 ETF, which tracks small caps, remains in a correction having fallen more than 10% from its 52-week high.
Still, Henrich says the markets still have a ways to go before a major breakdown occurs. So long as the S&P 500 holds at its critical support level above the 200-day moving average, the bull run should continue, though it depends on one key event, he says.
"It's very critical for the market to see a China deal being successful. Keep in mind we've rallied really hard in the last few months on the anticipation that such a deal would come to fruition. And now markets have actually priced that in. So now it's not clear there may be a lot more downside in some of the future earnings estimates if a deal does not come to fruition," he said.