Stock markets are slowly healing from the worst of the month's trade war sell-off.
One under-the-surface indicator suggests the S&P 500 might completely recover before breaking out to new highs, says former Goldman Sachs and Cowen market technician Helene Meisler.
"A couple of the indicators that I look at got extremely oversold early last week and continue in that direction," Meisler said on CNBC's "Trading Nation."
The Short-Term Trading Index, or Arms Index, for example, has spiked to a level typically suggesting an overflow of bearish sentiment. The TRIN, which measures the advance-decline line against the volume, is used to gauge sentiment.
"It reached a reading just shy of 1.35 last week, which is what we would consider oversold, and so I think that right now what we're enjoying is an oversold rally in the market based on that extreme we got last week," said Meisler, a RealMoney.com contributor.
Over the past 15 months, when the TRIN has reached those levels, it has corresponded with a bottom in the market. Meisler says that setup could repeat itself after this month's sell-off.
"You can see that in the first half of last year we had four such instances where we had extreme readings, and each time the market rallied. Sometimes it only rallied 5% and sometimes it rallied a lot more than that," said Meisler. "Last Monday we had over 90% of the volume on the NYSE on the downside, and that's usually an extreme reading that leads to oversold conditions because too much selling has taken place."
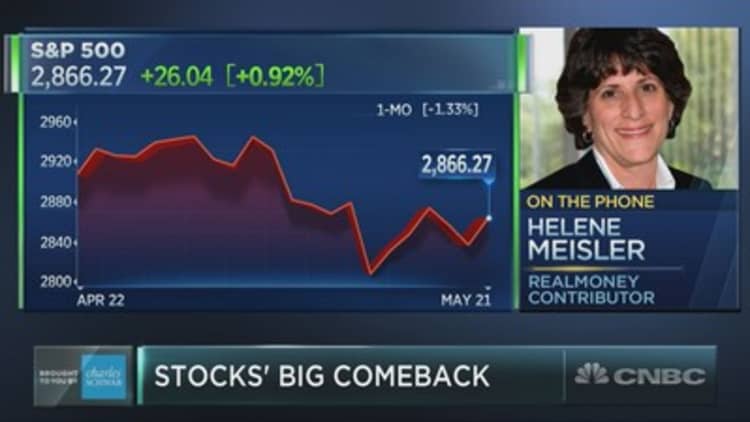
The most recent spike in the TRIN corresponded with a late June bottom. The then rallied 9% until it hit a peak on Sept. 21. The benchmark index has already climbed 2% since the May 13 bottom.
The options market also supports Meisler's forecast. The put/call ratio, which tracks the number of bearish puts placed again bullish calls, has become too extreme, she said.
"The put/call ratio for eight of the last nine trading days has been over 100%, which is unusual. To put that in perspective, last December we had 10 straight days and that was a major sell-off, whereas what we've had right now is 3% to 5%, and so people have gotten extremely bearish quite quickly," said Meisler.
"We [should] start to see those readings come down significantly in the next several days. You'll see that the sentiment is back to converting to bullishness," she said.