


Stocks are coming off a wild week.
The major benchmark indices, though suffering their worst day of the year on Monday, managed to end the week less than 1% lower.
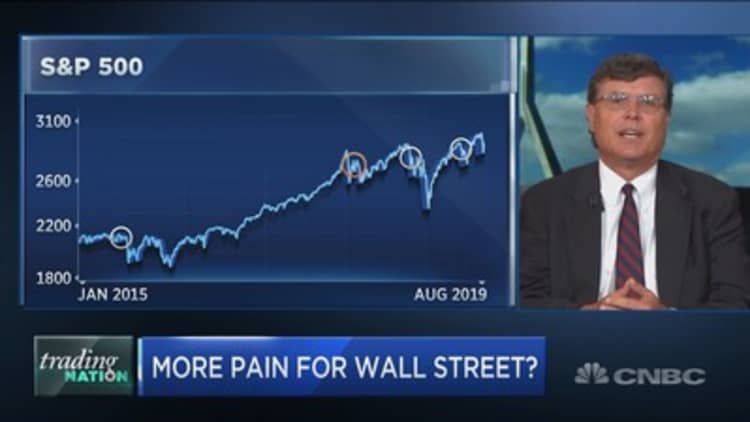
However, while the S&P 500 was able to recoup the worst of its losses, Miller Tabak equity strategist Matt Maley says it could get worse before it gets better.
"History tells us that whenever you get a sell-off on a short-term basis that is in reaction to new news, or a new development, the bottom we see on the initial sell-off is rarely the ultimate bottom. We usually see the market bounce a little bit, for a little while, and then roll to lower-low," said Maley on CNBC's "Trading Nation" on Friday.
For example, the S&P 500 tumbled 5% over two weeks at the beginning of May and rebounded 3% before tanking to fresh lows through the rest of the month. A similar pattern emerged in the fourth quarter last year, and in 2015 during the oil crash.
"What happens is the new news comes out, the market sells off, becomes oversold. We get a little bit of shorter bounce, but then people look around and say, 'Wait a minute. Nothing's really changed.' That negative news is still out there, and the market rolls back over again and makes new lows," said Maley.
The market sold off this week after President Donald Trump amped up the aggression in the trade war with China, promising fresh tariffs and threatening to scrap planned negotiations in September. At its worst, the S&P 500 had fallen 7% from an all-time high set in late July.
"Combine that kind of situation with the fundamentals where we see growth starting to slow, both earnings growth and economic growth, and we can see that with the yield curve," said Maley. "The 2-year, 10-year spread is getting very close to a straight flat line… and it gives us reasons to say that we'll see another dip before this thing finally bottoms out some time in the future."
The yield spread between the 2-year and 10-year Treasury note is taken as a recession indicator. A flat or negative spread indicates that investors are piling into longer-term Treasurys, suggesting concern the economy is going to slow and safe-haven assets are the best bet.
Steve Chiavarone, portfolio manager at Federated Investors, says stocks may be in for short-term pain, but sees a strong long-term bull case.
"It will become a great buying opportunity at some point, because President Trump, I think he'll push this trade thing a little bit longer than most people expect. But still, he's got the election next year, so there's going to be a trade truce. I think it'll probably come later than sooner, but it will come," said Chiavarone.
A trade deal and other global developments should support major upside in stocks, he adds.
"We think that global monetary stimulus and stable data here will lead to re-acceleration in the economy and earnings towards the end of the year and the markets can ultimately hit our 3100 target," said Chiavarone.
His target implies 6% upside from current levels before the year is out. It would also mark fresh highs for the S&P 500.


