It could be the S&P 500's sell-off signal.
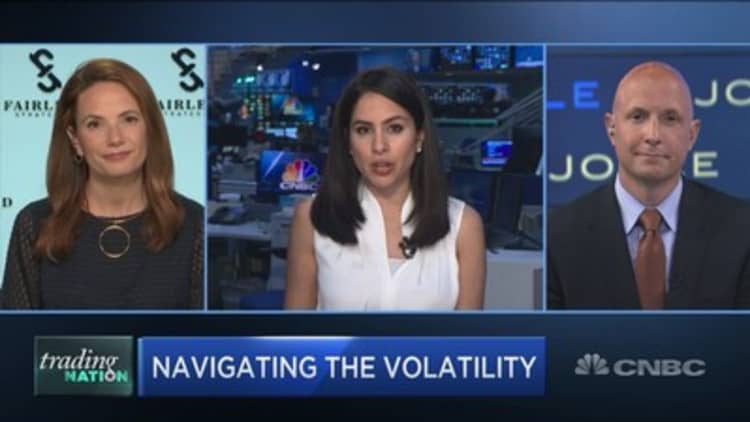
Fairlead Strategies founder and managing partner Katie Stockton has identified what she says is a key level that could alert investors to the next leg of the sell-off of the bellwether index. She spoke on CNBC's "Trading Nation" on Monday, a day that saw the S&P plunge more than 7.5% to 2,746.56, its worst daily percentage loss since December 2008. In Tuesday's premarket, the index was pointing to an opening at 2,865, a 4.27% gain.
"For the S&P 500, ... initial support in my work is just below 2,750," Stockton said, referencing a chart of the S&P. "It was the level targeted by the breakdown below 2,990, which was the previous level that we were watching."
She used a Fibonacci retracement to calculate that level, referencing a technical analysis that uses the 12th century mathematician's sequencing method to identify points of possible support or resistance on a trading chart.
Although the S&P did fall below the 2,750 level on Monday, Stockton said she needed confirmation of the breakdown to really be sure there was more weakness ahead.
"For a breakdown to be confirmed, I always require a couple of weekly closes below," she said. "Not to take too much of a wait-and-see approach, but it's often the right thing to do to wait for that confirmation, especially in such an emotionally charged environment. So, if we were to see a couple of weekly closes below that 2,750, the new targeted level would become 2,350, and that's based on — as you can guess — the December 2018 low."
A drop to 2,350 from the S&P's Monday closing prices would represent a nearly 14.5% decline. The S&P's lowest close in December 2018 was 2,351.10, according to FactSet.
Quint Tatro, founder and chief investment officer of Joule Financial, was watching two other sides of the market for signs of recovery.
"We're keeping an eye on the interest rate market. I think the 10-year yield has really been directing this market. Now, you factor in oil and what's going on in that environment," he said in the same "Trading Nation" interview, adding that those are the two areas where he'd like to "see stabilization."
With the 10-year Treasury yield hitting an record low on Monday as investors rushed into bonds, Tatro was hoping that the yield would eventually stabilize and catch "a little bit of a bid."
Oil prices could use a bid, too, Tatro said as the commodity wrapped up its worst trading day since 1991, down over 24.5% after OPEC leaders failed to come to an agreement on production cuts with the group's allies.
If Treasurys and oil prices show signs of recovery, Tatro said, he would look to "equities to be a buyer of deep discounts," as they would likely be the next group to turn.
However, Stockton still preached caution to those considering buying the dip.
With the 10-year yield, "the catch is we don't really have any support levels to key off of as a gauge of downside," she warned.
"But I would really agree that it's always smart to wait for that bid," she said. "Wait for the uptick in momentum, or at least a shift, as opposed to trying to buy into this kind of gap down. The gaps down do tend to be exhaustive, and yet it doesn't usually pay off to buy right into it."
The 10-year yield rose to 0.693% early Tuesday.


